Brazilian vs Comanche Unemployment Among Seniors over 65 years
COMPARE
Brazilian
Comanche
Unemployment Among Seniors over 65 years
Unemployment Among Seniors over 65 years Comparison
Brazilians
Comanche
5.5%
UNEMPLOYMENT AMONG SENIORS OVER 65 YEARS
0.1/ 100
METRIC RATING
279th/ 347
METRIC RANK
4.6%
UNEMPLOYMENT AMONG SENIORS OVER 65 YEARS
100.0/ 100
METRIC RATING
11th/ 347
METRIC RANK
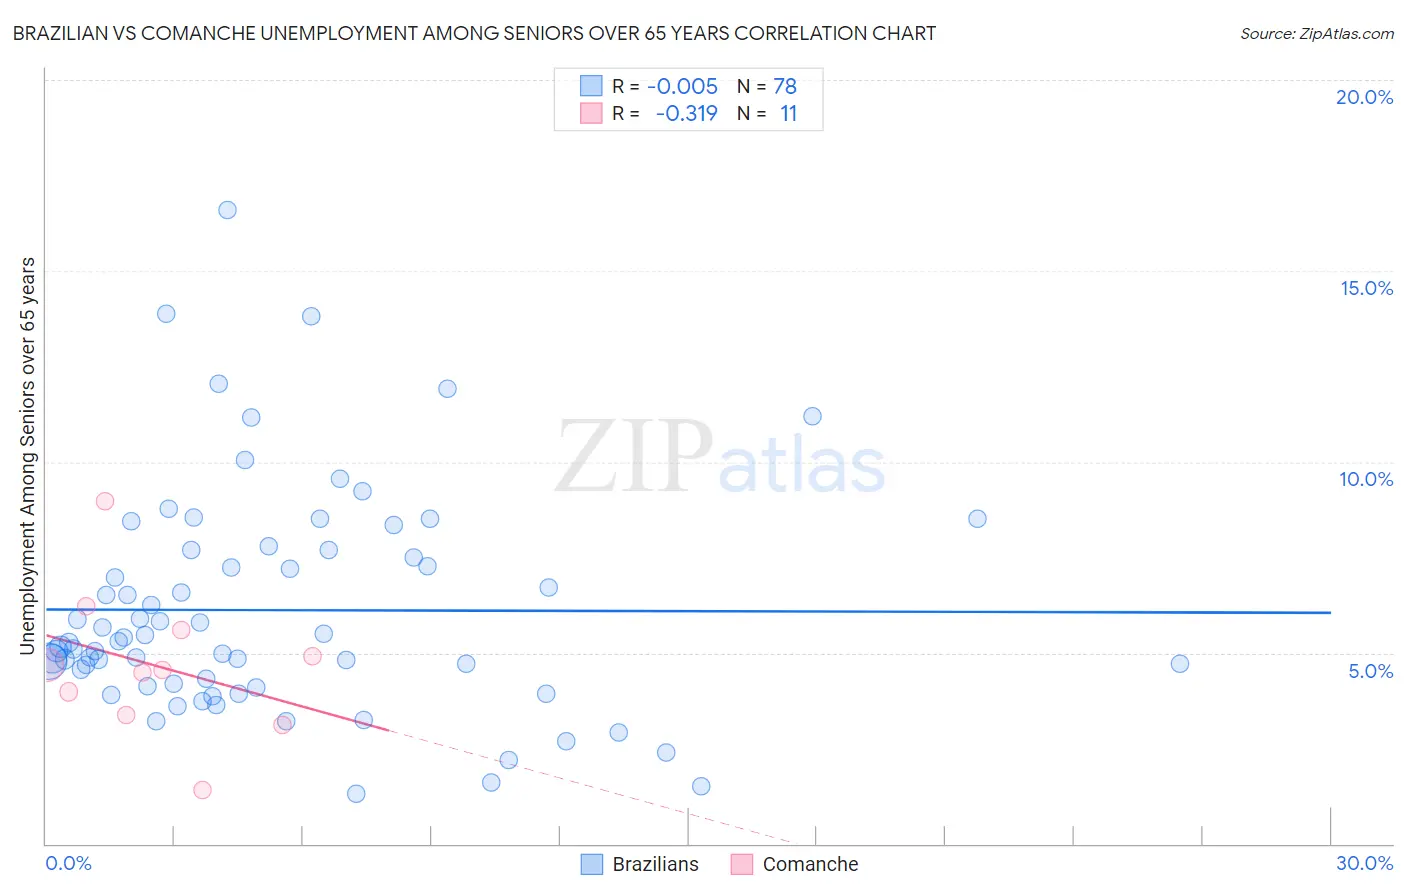
Brazilian vs Comanche Unemployment Among Seniors over 65 years Correlation Chart
The statistical analysis conducted on geographies consisting of 299,873,238 people shows no correlation between the proportion of Brazilians and unemployment rate amomg seniors over the age of 65 in the United States with a correlation coefficient (R) of -0.005 and weighted average of 5.5%. Similarly, the statistical analysis conducted on geographies consisting of 103,902,741 people shows a mild negative correlation between the proportion of Comanche and unemployment rate amomg seniors over the age of 65 in the United States with a correlation coefficient (R) of -0.319 and weighted average of 4.6%, a difference of 19.4%.
Unemployment Among Seniors over 65 years Correlation Summary
| Measurement | Brazilian | Comanche |
| Minimum | 1.3% | 1.4% |
| Maximum | 16.6% | 9.0% |
| Range | 15.3% | 7.6% |
| Mean | 6.1% | 4.7% |
| Median | 5.3% | 4.5% |
| Interquartile 25% (IQ1) | 4.2% | 3.4% |
| Interquartile 75% (IQ3) | 7.7% | 5.6% |
| Interquartile Range (IQR) | 3.5% | 2.2% |
| Standard Deviation (Sample) | 2.9% | 1.9% |
| Standard Deviation (Population) | 2.9% | 1.8% |
Similar Demographics by Unemployment Among Seniors over 65 years
Demographics Similar to Brazilians by Unemployment Among Seniors over 65 years
In terms of unemployment among seniors over 65 years, the demographic groups most similar to Brazilians are Immigrants from South America (5.5%, a difference of 0.040%), Colville (5.4%, a difference of 0.12%), Immigrants from Norway (5.5%, a difference of 0.19%), Immigrants from Western Africa (5.4%, a difference of 0.23%), and Pueblo (5.4%, a difference of 0.26%).
| Demographics | Rating | Rank | Unemployment Among Seniors over 65 years |
| Immigrants | Jamaica | 0.1 /100 | #272 | Tragic 5.4% |
| Immigrants | Nigeria | 0.1 /100 | #273 | Tragic 5.4% |
| Immigrants | Brazil | 0.1 /100 | #274 | Tragic 5.4% |
| Mexican American Indians | 0.1 /100 | #275 | Tragic 5.4% |
| Pueblo | 0.1 /100 | #276 | Tragic 5.4% |
| Immigrants | Western Africa | 0.1 /100 | #277 | Tragic 5.4% |
| Colville | 0.1 /100 | #278 | Tragic 5.4% |
| Brazilians | 0.1 /100 | #279 | Tragic 5.5% |
| Immigrants | South America | 0.1 /100 | #280 | Tragic 5.5% |
| Immigrants | Norway | 0.0 /100 | #281 | Tragic 5.5% |
| Immigrants | Belize | 0.0 /100 | #282 | Tragic 5.5% |
| Immigrants | Haiti | 0.0 /100 | #283 | Tragic 5.5% |
| Immigrants | Liberia | 0.0 /100 | #284 | Tragic 5.5% |
| Central Americans | 0.0 /100 | #285 | Tragic 5.5% |
| Immigrants | Barbados | 0.0 /100 | #286 | Tragic 5.5% |
Demographics Similar to Comanche by Unemployment Among Seniors over 65 years
In terms of unemployment among seniors over 65 years, the demographic groups most similar to Comanche are Immigrants from Zaire (4.5%, a difference of 0.41%), Indonesian (4.5%, a difference of 0.42%), Osage (4.6%, a difference of 0.88%), Tsimshian (4.5%, a difference of 0.91%), and Cuban (4.6%, a difference of 0.98%).
| Demographics | Rating | Rank | Unemployment Among Seniors over 65 years |
| Sudanese | 100.0 /100 | #4 | Exceptional 4.4% |
| Chickasaw | 100.0 /100 | #5 | Exceptional 4.4% |
| Immigrants | Cuba | 100.0 /100 | #6 | Exceptional 4.5% |
| Immigrants | Congo | 100.0 /100 | #7 | Exceptional 4.5% |
| Tsimshian | 100.0 /100 | #8 | Exceptional 4.5% |
| Indonesians | 100.0 /100 | #9 | Exceptional 4.5% |
| Immigrants | Zaire | 100.0 /100 | #10 | Exceptional 4.5% |
| Comanche | 100.0 /100 | #11 | Exceptional 4.6% |
| Osage | 100.0 /100 | #12 | Exceptional 4.6% |
| Cubans | 100.0 /100 | #13 | Exceptional 4.6% |
| Menominee | 100.0 /100 | #14 | Exceptional 4.6% |
| Lumbee | 100.0 /100 | #15 | Exceptional 4.6% |
| Immigrants | Burma/Myanmar | 100.0 /100 | #16 | Exceptional 4.6% |
| Creek | 100.0 /100 | #17 | Exceptional 4.6% |
| Immigrants | Eritrea | 100.0 /100 | #18 | Exceptional 4.7% |