Black/African American vs Creek Female Unemployment
COMPARE
Black/African American
Creek
Female Unemployment
Female Unemployment Comparison
Blacks/African Americans
Creek
6.5%
FEMALE UNEMPLOYMENT
0.0/ 100
METRIC RATING
321st/ 347
METRIC RANK
5.4%
FEMALE UNEMPLOYMENT
15.4/ 100
METRIC RATING
207th/ 347
METRIC RANK
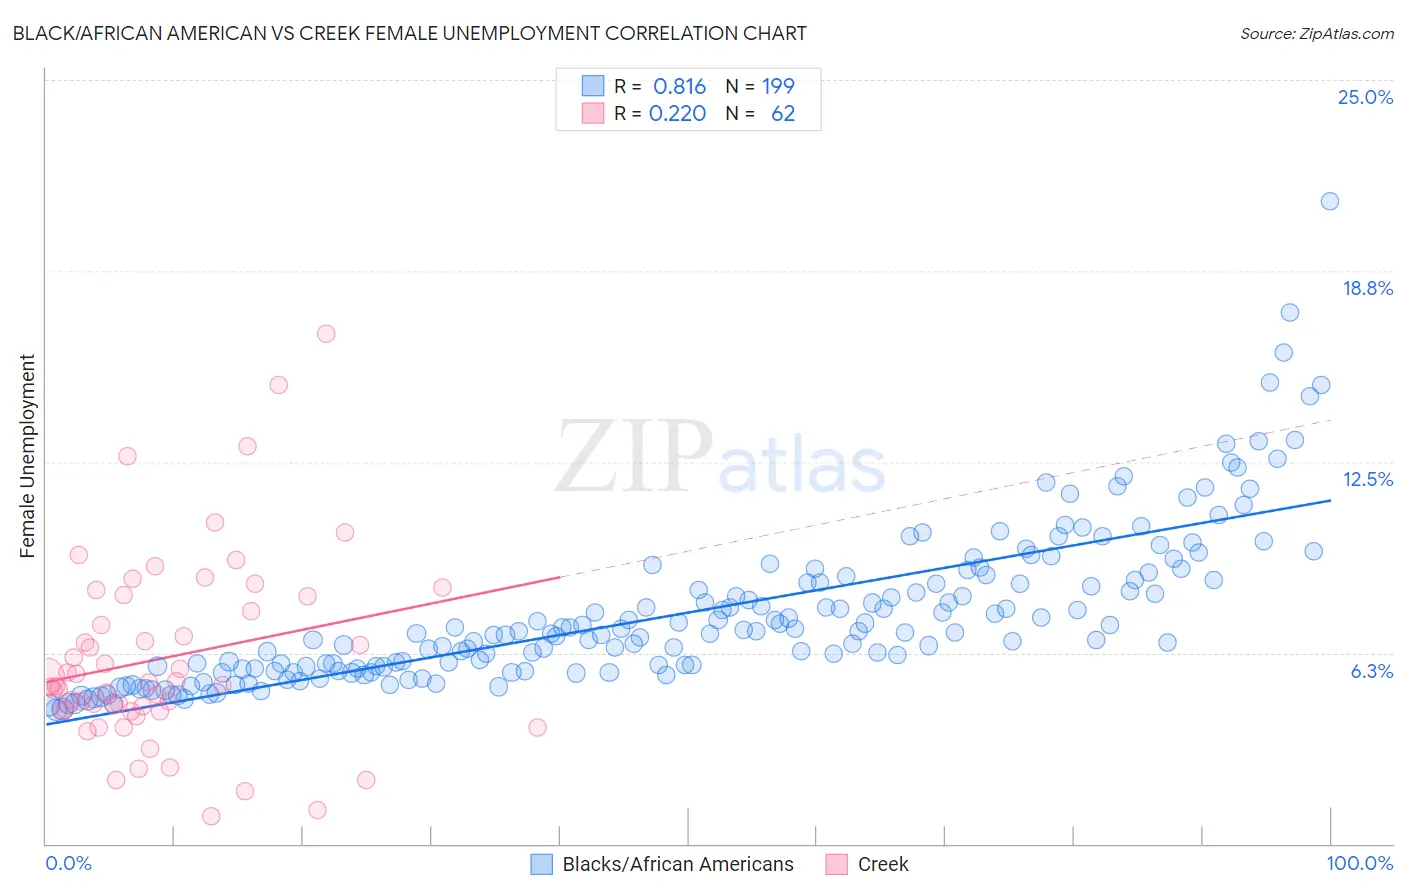
Black/African American vs Creek Female Unemployment Correlation Chart
The statistical analysis conducted on geographies consisting of 554,894,161 people shows a very strong positive correlation between the proportion of Blacks/African Americans and unemploymnet rate among females in the United States with a correlation coefficient (R) of 0.816 and weighted average of 6.5%. Similarly, the statistical analysis conducted on geographies consisting of 177,704,441 people shows a weak positive correlation between the proportion of Creek and unemploymnet rate among females in the United States with a correlation coefficient (R) of 0.220 and weighted average of 5.4%, a difference of 20.4%.
Female Unemployment Correlation Summary
| Measurement | Black/African American | Creek |
| Minimum | 4.4% | 0.90% |
| Maximum | 21.0% | 16.7% |
| Range | 16.6% | 15.8% |
| Mean | 7.6% | 6.1% |
| Median | 6.9% | 5.2% |
| Interquartile 25% (IQ1) | 5.7% | 4.3% |
| Interquartile 75% (IQ3) | 8.6% | 8.1% |
| Interquartile Range (IQR) | 2.9% | 3.8% |
| Standard Deviation (Sample) | 2.6% | 3.1% |
| Standard Deviation (Population) | 2.6% | 3.1% |
Similar Demographics by Female Unemployment
Demographics Similar to Blacks/African Americans by Female Unemployment
In terms of female unemployment, the demographic groups most similar to Blacks/African Americans are Vietnamese (6.5%, a difference of 0.080%), Immigrants from Belize (6.5%, a difference of 0.18%), Immigrants from Dominica (6.5%, a difference of 0.54%), Immigrants from Bangladesh (6.5%, a difference of 0.55%), and British West Indian (6.4%, a difference of 0.74%).
| Demographics | Rating | Rank | Female Unemployment |
| Immigrants | Ecuador | 0.0 /100 | #314 | Tragic 6.4% |
| Pueblo | 0.0 /100 | #315 | Tragic 6.4% |
| Houma | 0.0 /100 | #316 | Tragic 6.4% |
| Immigrants | St. Vincent and the Grenadines | 0.0 /100 | #317 | Tragic 6.4% |
| British West Indians | 0.0 /100 | #318 | Tragic 6.4% |
| Immigrants | Bangladesh | 0.0 /100 | #319 | Tragic 6.5% |
| Immigrants | Dominica | 0.0 /100 | #320 | Tragic 6.5% |
| Blacks/African Americans | 0.0 /100 | #321 | Tragic 6.5% |
| Vietnamese | 0.0 /100 | #322 | Tragic 6.5% |
| Immigrants | Belize | 0.0 /100 | #323 | Tragic 6.5% |
| Cheyenne | 0.0 /100 | #324 | Tragic 6.6% |
| Apache | 0.0 /100 | #325 | Tragic 6.6% |
| Natives/Alaskans | 0.0 /100 | #326 | Tragic 6.6% |
| Alaska Natives | 0.0 /100 | #327 | Tragic 6.6% |
| Guyanese | 0.0 /100 | #328 | Tragic 6.7% |
Demographics Similar to Creek by Female Unemployment
In terms of female unemployment, the demographic groups most similar to Creek are Immigrants from Costa Rica (5.4%, a difference of 0.19%), Korean (5.4%, a difference of 0.24%), Immigrants from Brazil (5.4%, a difference of 0.35%), Immigrants from Afghanistan (5.4%, a difference of 0.37%), and Choctaw (5.4%, a difference of 0.38%).
| Demographics | Rating | Rank | Female Unemployment |
| Soviet Union | 21.7 /100 | #200 | Fair 5.4% |
| Immigrants | Middle Africa | 20.8 /100 | #201 | Fair 5.4% |
| Iroquois | 20.8 /100 | #202 | Fair 5.4% |
| Immigrants | South Eastern Asia | 20.3 /100 | #203 | Fair 5.4% |
| Immigrants | Israel | 19.7 /100 | #204 | Poor 5.4% |
| Immigrants | Afghanistan | 18.9 /100 | #205 | Poor 5.4% |
| Immigrants | Brazil | 18.8 /100 | #206 | Poor 5.4% |
| Creek | 15.4 /100 | #207 | Poor 5.4% |
| Immigrants | Costa Rica | 13.7 /100 | #208 | Poor 5.4% |
| Koreans | 13.4 /100 | #209 | Poor 5.4% |
| Choctaw | 12.3 /100 | #210 | Poor 5.4% |
| Ottawa | 11.6 /100 | #211 | Poor 5.4% |
| Uruguayans | 11.4 /100 | #212 | Poor 5.4% |
| Samoans | 10.6 /100 | #213 | Poor 5.4% |
| Seminole | 10.3 /100 | #214 | Poor 5.4% |