Blackfeet vs Russian Unemployment Among Women with Children Under 6 years

COMPARE

Blackfeet
Race
Ancestry
AfghanAfricanAlaska NativeAlaskan AthabascanAlbanianAleutAlsatianAmericanApacheArabArapahoArgentineanArmenianAssyrian/Chaldean/SyriacAustralianAustrianBahamianBangladeshiBarbadianBasqueBelgianBelizeanBermudanBhutaneseBlackfeetBolivianBrazilianBritishBritish West IndianBulgarianBurmeseCajunCambodianCanadianCape VerdeanCarpatho RusynCelticCentral AmericanCentral American IndianCherokeeCheyenneChickasawChileanChineseChippewaChoctawColombianColvilleComancheCosta RicanCreeCreekCroatianCrowCubanCypriotCzechCzechoslovakianDanishDelawareDominicanDutchDutch West IndianEastern EuropeanEcuadorianEgyptianEnglishEstonianEthiopianEuropeanFijianFilipinoFinnishFrenchFrench American IndianFrench CanadianGermanGerman RussianGhanaianGreekGuamanian/ChamorroGuatemalanGuyaneseHaitianHmongHonduranHopiHoumaHungarianIcelanderIndian (Asian)IndonesianInupiatIranianIraqiIrishIroquoisIsraeliItalianJamaicanJapaneseJordanianKenyanKiowaKoreanLaotianLatvianLebaneseLiberianLithuanianLumbeeLuxembourgerMacedonianMalaysianMalteseMarshalleseMenomineeMexicanMexican American IndianMongolianMoroccanNative HawaiianNavajoNepaleseNew ZealanderNicaraguanNigerianNorthern EuropeanNorwegianOkinawanOsageOttawaPaiutePakistaniPalestinianPanamanianParaguayanPennsylvania GermanPeruvianPimaPolishPortuguesePotawatomiPuebloPuerto RicanPuget Sound SalishRomanianSalvadoranSamoanScandinavianScotch-IrishScottishSeminoleSenegaleseSerbianShoshoneSierra LeoneanSiouxSlavicSlovakSloveneSomaliSouth AfricanSouth AmericanSouth American IndianSoviet UnionSpaniardSpanishSpanish AmericanSpanish American IndianSri LankanSubsaharan AfricanSudaneseSwedishSwissSyrianTaiwaneseThaiTlingit-HaidaTohono O'OdhamTonganTrinidadian and TobagonianTsimshianTurkishU.S. Virgin IslanderUgandanUkrainianUruguayanUteVenezuelanVietnameseWelshWest IndianYakamaYaquiYugoslavianYumanYup'ikZimbabwean
Immigration
NonimmigrantsImmigrantsAfghanistanAfricaAlbaniaArgentinaArmeniaAsiaAustraliaAustriaBahamasBangladeshBarbadosBelarusBelgiumBelizeBoliviaBosnia and HerzegovinaBrazilBulgariaBurma/MyanmarCabo VerdeCambodiaCameroonCanadaCaribbeanCentral AmericaChileChinaColombiaCongoCosta RicaCroatiaCubaCzechoslovakiaDenmarkDominicaDominican RepublicEastern AfricaEastern AsiaEastern EuropeEcuadorEgyptEl SalvadorEnglandEritreaEthiopiaEuropeFijiFranceGermanyGhanaGreeceGrenadaGuatemalaGuyanaHaitiHondurasHong KongHungaryIndiaIndonesiaIranIraqIrelandIsraelItalyJamaicaJapanJordanKazakhstanKenyaKoreaKuwaitLaosLatin AmericaLatviaLebanonLiberiaLithuaniaMalaysiaMexicoMicronesiaMiddle AfricaMoldovaMoroccoNepalNetherlandsNicaraguaNigeriaNorth AmericaNorth MacedoniaNorthern AfricaNorthern EuropeNorwayOceaniaPakistanPanamaPeruPhilippinesPolandPortugalRomaniaRussiaSaudi ArabiaScotlandSenegalSerbiaSierra LeoneSingaporeSomaliaSouth AfricaSouth AmericaSouth Central AsiaSouth Eastern AsiaSouthern EuropeSpainSri LankaSt. Vincent and the GrenadinesSudanSwedenSwitzerlandSyriaTaiwanThailandTrinidad and TobagoTurkeyUgandaUkraineUruguayUzbekistanVenezuelaVietnamWest IndiesWestern AfricaWestern AsiaWestern EuropeYemenZaireZimbabweAzores
Russian
Race
Ancestry
AfghanAfricanAlaska NativeAlaskan AthabascanAlbanianAleutAlsatianAmericanApacheArabArapahoArgentineanArmenianAssyrian/Chaldean/SyriacAustralianAustrianBahamianBangladeshiBarbadianBasqueBelgianBelizeanBermudanBhutaneseBolivianBrazilianBritishBritish West IndianBulgarianBurmeseCajunCambodianCanadianCape VerdeanCarpatho RusynCelticCentral AmericanCentral American IndianCherokeeCheyenneChickasawChileanChineseChippewaChoctawColombianColvilleComancheCosta RicanCreeCreekCroatianCrowCubanCypriotCzechCzechoslovakianDanishDelawareDominicanDutchDutch West IndianEastern EuropeanEcuadorianEgyptianEnglishEstonianEthiopianEuropeanFijianFilipinoFinnishFrenchFrench American IndianFrench CanadianGermanGerman RussianGhanaianGreekGuamanian/ChamorroGuatemalanGuyaneseHaitianHmongHonduranHopiHoumaHungarianIcelanderIndian (Asian)IndonesianInupiatIranianIraqiIrishIroquoisIsraeliItalianJamaicanJapaneseJordanianKenyanKiowaKoreanLaotianLatvianLebaneseLiberianLithuanianLumbeeLuxembourgerMacedonianMalaysianMalteseMarshalleseMenomineeMexicanMexican American IndianMongolianMoroccanNative HawaiianNavajoNepaleseNew ZealanderNicaraguanNigerianNorthern EuropeanNorwegianOkinawanOsageOttawaPaiutePakistaniPalestinianPanamanianParaguayanPennsylvania GermanPeruvianPimaPolishPortuguesePotawatomiPuebloPuerto RicanPuget Sound SalishRomanianRussianSalvadoranSamoanScandinavianScotch-IrishScottishSeminoleSenegaleseSerbianShoshoneSierra LeoneanSiouxSlavicSlovakSloveneSomaliSouth AfricanSouth AmericanSouth American IndianSoviet UnionSpaniardSpanishSpanish AmericanSpanish American IndianSri LankanSubsaharan AfricanSudaneseSwedishSwissSyrianTaiwaneseThaiTlingit-HaidaTohono O'OdhamTonganTrinidadian and TobagonianTsimshianTurkishU.S. Virgin IslanderUgandanUkrainianUruguayanUteVenezuelanVietnameseWelshWest IndianYakamaYaquiYugoslavianYumanYup'ikZimbabwean
Immigration
NonimmigrantsImmigrantsAfghanistanAfricaAlbaniaArgentinaArmeniaAsiaAustraliaAustriaBahamasBangladeshBarbadosBelarusBelgiumBelizeBoliviaBosnia and HerzegovinaBrazilBulgariaBurma/MyanmarCabo VerdeCambodiaCameroonCanadaCaribbeanCentral AmericaChileChinaColombiaCongoCosta RicaCroatiaCubaCzechoslovakiaDenmarkDominicaDominican RepublicEastern AfricaEastern AsiaEastern EuropeEcuadorEgyptEl SalvadorEnglandEritreaEthiopiaEuropeFijiFranceGermanyGhanaGreeceGrenadaGuatemalaGuyanaHaitiHondurasHong KongHungaryIndiaIndonesiaIranIraqIrelandIsraelItalyJamaicaJapanJordanKazakhstanKenyaKoreaKuwaitLaosLatin AmericaLatviaLebanonLiberiaLithuaniaMalaysiaMexicoMicronesiaMiddle AfricaMoldovaMoroccoNepalNetherlandsNicaraguaNigeriaNorth AmericaNorth MacedoniaNorthern AfricaNorthern EuropeNorwayOceaniaPakistanPanamaPeruPhilippinesPolandPortugalRomaniaRussiaSaudi ArabiaScotlandSenegalSerbiaSierra LeoneSingaporeSomaliaSouth AfricaSouth AmericaSouth Central AsiaSouth Eastern AsiaSouthern EuropeSpainSri LankaSt. Vincent and the GrenadinesSudanSwedenSwitzerlandSyriaTaiwanThailandTrinidad and TobagoTurkeyUgandaUkraineUruguayUzbekistanVenezuelaVietnamWest IndiesWestern AfricaWestern AsiaWestern EuropeYemenZaireZimbabweAzores
Unemployment Among Women with Children Under 6 years
Income
Poverty
Unemployment
Labor Participation
Family Structure
Vehicle Availability
Education Level
Disability

Unemployment Among Women with Children Under 6 years Comparison

Blackfeet

Russians

Tragic
Exceptional
8.7%
UNEMPLOYMENT AMONG WOMEN WITH CHILDREN UNDER 6 YEARS
0.0/ 100
METRIC RATING
284th/ 347
METRIC RANK
7.2%
UNEMPLOYMENT AMONG WOMEN WITH CHILDREN UNDER 6 YEARS
97.5/ 100
METRIC RATING
98th/ 347
METRIC RANK

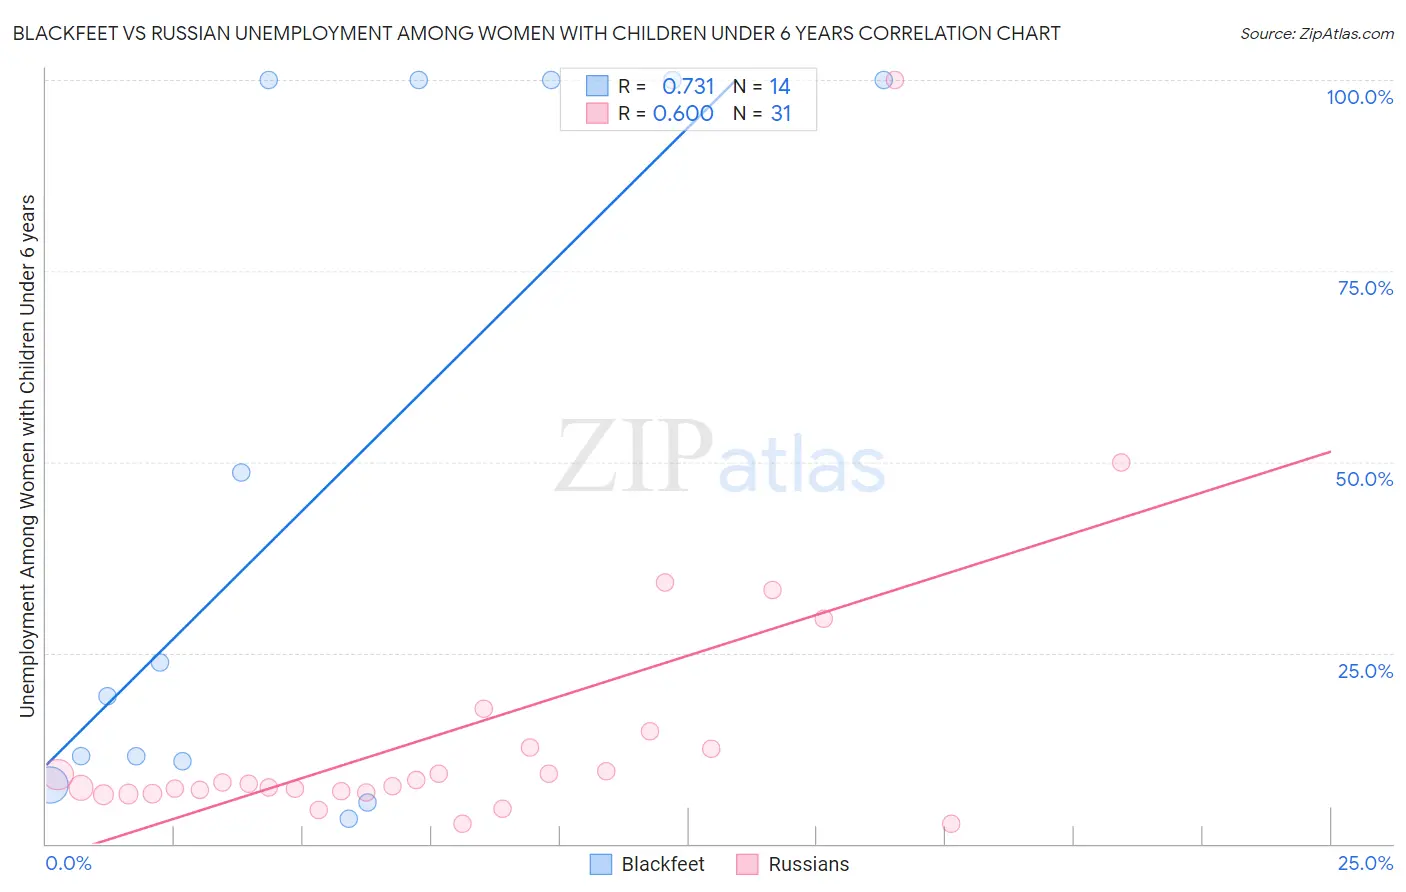
Blackfeet vs Russian Unemployment Among Women with Children Under 6 years Correlation Chart

The statistical analysis conducted on geographies consisting of 246,110,374 people shows a strong positive correlation between the proportion of Blackfeet and unemployment rate among women with children under the age of 6 in the United States with a correlation coefficient (R) of 0.731 and weighted average of 8.7%. Similarly, the statistical analysis conducted on geographies consisting of 355,681,111 people shows a substantial positive correlation between the proportion of Russians and unemployment rate among women with children under the age of 6 in the United States with a correlation coefficient (R) of 0.600 and weighted average of 7.2%, a difference of 20.9%.
Blackfeet vs Russian Unemployment Among Women with Children Under 6 years

Unemployment Among Women with Children Under 6 years Correlation Summary

MeasurementBlackfeetRussian
Minimum3.2%2.6%
Maximum100.0%100.0%
Range96.8%97.4%
Mean45.8%14.7%
Median21.5%7.8%
Interquartile 25% (IQ1)10.7%6.7%
Interquartile 75% (IQ3)100.0%12.6%
Interquartile Range (IQR)89.3%5.9%
Standard Deviation (Sample)43.3%19.1%
Standard Deviation (Population)41.7%18.8%

Similar Demographics by Unemployment Among Women with Children Under 6 years

Demographics Similar to Blackfeet by Unemployment Among Women with Children Under 6 years

In terms of unemployment among women with children under 6 years, the demographic groups most similar to Blackfeet are Spanish American Indian (8.7%, a difference of 0.16%), Bermudan (8.7%, a difference of 0.18%), U.S. Virgin Islander (8.7%, a difference of 0.20%), Seminole (8.7%, a difference of 0.20%), and Guatemalan (8.7%, a difference of 0.27%).
DemographicsRating | RankUnemployment Among Women with Children Under 6 years
Haitians
0.0
/100
|
#277
Tragic
8.6%
Immigrants | Dominica
0.0
/100
|
#278
Tragic
8.6%
Immigrants | Guatemala
0.0
/100
|
#279
Tragic
8.6%
Immigrants | Belize
0.0
/100
|
#280
Tragic
8.6%
Guatemalans
0.0
/100
|
#281
Tragic
8.7%
Bermudans
0.0
/100
|
#282
Tragic
8.7%
Spanish American Indians
0.0
/100
|
#283
Tragic
8.7%
Blackfeet
0.0
/100
|
#284
Tragic
8.7%
U.S. Virgin Islanders
0.0
/100
|
#285
Tragic
8.7%
Seminole
0.0
/100
|
#286
Tragic
8.7%
Menominee
0.0
/100
|
#287
Tragic
8.7%
Bahamians
0.0
/100
|
#288
Tragic
8.7%
Iroquois
0.0
/100
|
#289
Tragic
8.7%
Vietnamese
0.0
/100
|
#290
Tragic
8.8%
Jamaicans
0.0
/100
|
#291
Tragic
8.8%

Demographics Similar to Russians by Unemployment Among Women with Children Under 6 years

In terms of unemployment among women with children under 6 years, the demographic groups most similar to Russians are Immigrants from South Eastern Asia (7.2%, a difference of 0.030%), Immigrants from Europe (7.2%, a difference of 0.040%), Immigrants from Northern Europe (7.2%, a difference of 0.080%), Immigrants from Eastern Africa (7.2%, a difference of 0.11%), and Chilean (7.2%, a difference of 0.11%).
DemographicsRating | RankUnemployment Among Women with Children Under 6 years
Danes
98.2
/100
|
#91
Exceptional
7.1%
Albanians
98.0
/100
|
#92
Exceptional
7.2%
New Zealanders
97.8
/100
|
#93
Exceptional
7.2%
Macedonians
97.7
/100
|
#94
Exceptional
7.2%
Romanians
97.7
/100
|
#95
Exceptional
7.2%
Immigrants | Eastern Africa
97.7
/100
|
#96
Exceptional
7.2%
Immigrants | South Eastern Asia
97.6
/100
|
#97
Exceptional
7.2%
Russians
97.5
/100
|
#98
Exceptional
7.2%
Immigrants | Europe
97.5
/100
|
#99
Exceptional
7.2%
Immigrants | Northern Europe
97.4
/100
|
#100
Exceptional
7.2%
Chileans
97.4
/100
|
#101
Exceptional
7.2%
Immigrants | Nicaragua
97.3
/100
|
#102
Exceptional
7.2%
Immigrants | Saudi Arabia
97.3
/100
|
#103
Exceptional
7.2%
Immigrants | Egypt
97.2
/100
|
#104
Exceptional
7.2%
Venezuelans
97.2
/100
|
#105
Exceptional
7.2%