Bermudan vs Immigrants from Fiji Unemployment Among Ages 20 to 24 years
COMPARE
Bermudan
Immigrants from Fiji
Unemployment Among Ages 20 to 24 years
Unemployment Among Ages 20 to 24 years Comparison
Bermudans
Immigrants from Fiji
12.5%
UNEMPLOYMENT AMONG AGES 20 TO 24 YEARS
0.0/ 100
METRIC RATING
307th/ 347
METRIC RANK
10.3%
UNEMPLOYMENT AMONG AGES 20 TO 24 YEARS
57.6/ 100
METRIC RATING
167th/ 347
METRIC RANK
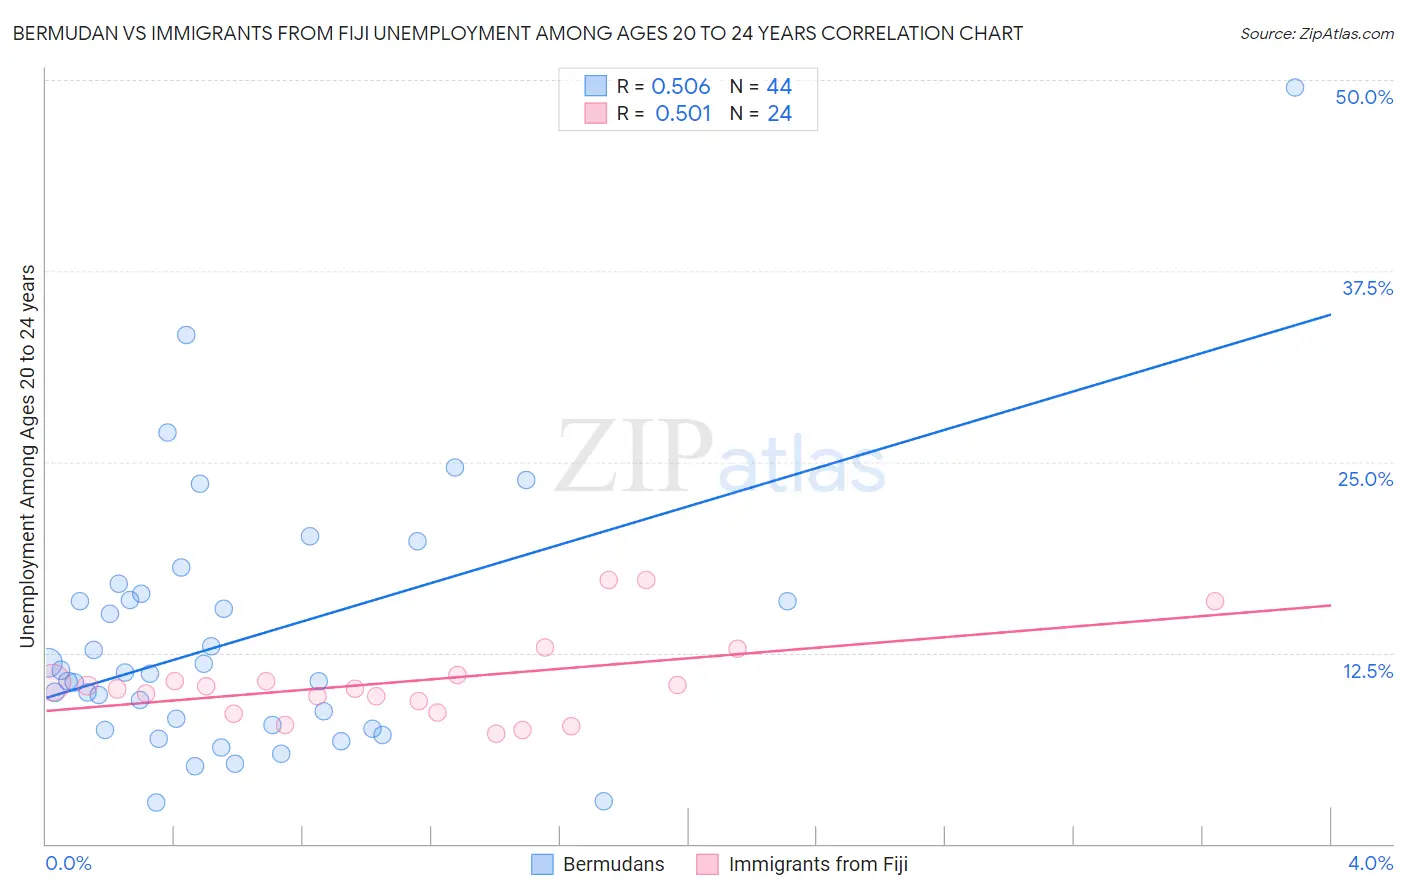
Bermudan vs Immigrants from Fiji Unemployment Among Ages 20 to 24 years Correlation Chart
The statistical analysis conducted on geographies consisting of 55,489,171 people shows a substantial positive correlation between the proportion of Bermudans and unemployment rate among population between the ages 20 and 24 in the United States with a correlation coefficient (R) of 0.506 and weighted average of 12.5%. Similarly, the statistical analysis conducted on geographies consisting of 93,497,252 people shows a substantial positive correlation between the proportion of Immigrants from Fiji and unemployment rate among population between the ages 20 and 24 in the United States with a correlation coefficient (R) of 0.501 and weighted average of 10.3%, a difference of 21.2%.
Unemployment Among Ages 20 to 24 years Correlation Summary
| Measurement | Bermudan | Immigrants from Fiji |
| Minimum | 2.7% | 7.2% |
| Maximum | 49.5% | 17.3% |
| Range | 46.8% | 10.1% |
| Mean | 13.5% | 10.7% |
| Median | 11.2% | 10.2% |
| Interquartile 25% (IQ1) | 7.6% | 9.0% |
| Interquartile 75% (IQ3) | 16.2% | 10.8% |
| Interquartile Range (IQR) | 8.5% | 1.9% |
| Standard Deviation (Sample) | 8.7% | 2.8% |
| Standard Deviation (Population) | 8.6% | 2.7% |
Similar Demographics by Unemployment Among Ages 20 to 24 years
Demographics Similar to Bermudans by Unemployment Among Ages 20 to 24 years
In terms of unemployment among ages 20 to 24 years, the demographic groups most similar to Bermudans are Immigrants from Haiti (12.4%, a difference of 0.44%), Tohono O'odham (12.5%, a difference of 0.68%), Immigrants from Bangladesh (12.6%, a difference of 0.76%), Jamaican (12.6%, a difference of 0.89%), and Chippewa (12.3%, a difference of 1.3%).
| Demographics | Rating | Rank | Unemployment Among Ages 20 to 24 years |
| Spanish American Indians | 0.0 /100 | #300 | Tragic 12.1% |
| Immigrants | Sierra Leone | 0.0 /100 | #301 | Tragic 12.1% |
| Immigrants | Cabo Verde | 0.0 /100 | #302 | Tragic 12.2% |
| Haitians | 0.0 /100 | #303 | Tragic 12.2% |
| Immigrants | West Indies | 0.0 /100 | #304 | Tragic 12.3% |
| Chippewa | 0.0 /100 | #305 | Tragic 12.3% |
| Immigrants | Haiti | 0.0 /100 | #306 | Tragic 12.4% |
| Bermudans | 0.0 /100 | #307 | Tragic 12.5% |
| Tohono O'odham | 0.0 /100 | #308 | Tragic 12.5% |
| Immigrants | Bangladesh | 0.0 /100 | #309 | Tragic 12.6% |
| Jamaicans | 0.0 /100 | #310 | Tragic 12.6% |
| Vietnamese | 0.0 /100 | #311 | Tragic 12.6% |
| Houma | 0.0 /100 | #312 | Tragic 12.6% |
| Shoshone | 0.0 /100 | #313 | Tragic 12.7% |
| Blacks/African Americans | 0.0 /100 | #314 | Tragic 12.7% |
Demographics Similar to Immigrants from Fiji by Unemployment Among Ages 20 to 24 years
In terms of unemployment among ages 20 to 24 years, the demographic groups most similar to Immigrants from Fiji are Italian (10.3%, a difference of 0.0%), Lebanese (10.3%, a difference of 0.020%), Iraqi (10.3%, a difference of 0.030%), Immigrants from Korea (10.3%, a difference of 0.050%), and Immigrants from Colombia (10.3%, a difference of 0.050%).
| Demographics | Rating | Rank | Unemployment Among Ages 20 to 24 years |
| Spaniards | 63.4 /100 | #160 | Good 10.3% |
| Indians (Asian) | 62.6 /100 | #161 | Good 10.3% |
| Immigrants | Asia | 61.3 /100 | #162 | Good 10.3% |
| Estonians | 61.1 /100 | #163 | Good 10.3% |
| Immigrants | Korea | 59.0 /100 | #164 | Average 10.3% |
| Lebanese | 58.3 /100 | #165 | Average 10.3% |
| Italians | 57.7 /100 | #166 | Average 10.3% |
| Immigrants | Fiji | 57.6 /100 | #167 | Average 10.3% |
| Iraqis | 56.7 /100 | #168 | Average 10.3% |
| Immigrants | Colombia | 56.3 /100 | #169 | Average 10.3% |
| Turks | 55.2 /100 | #170 | Average 10.3% |
| Immigrants | Eastern Asia | 52.7 /100 | #171 | Average 10.3% |
| Koreans | 51.9 /100 | #172 | Average 10.3% |
| Immigrants | Sweden | 50.8 /100 | #173 | Average 10.3% |
| Ukrainians | 50.0 /100 | #174 | Average 10.3% |