Belizean vs Sioux Male Unemployment
COMPARE
Belizean
Sioux
Male Unemployment
Male Unemployment Comparison
Belizeans
Sioux
6.5%
MALE UNEMPLOYMENT
0.0/ 100
METRIC RATING
295th/ 347
METRIC RANK
8.4%
MALE UNEMPLOYMENT
0.0/ 100
METRIC RATING
333rd/ 347
METRIC RANK
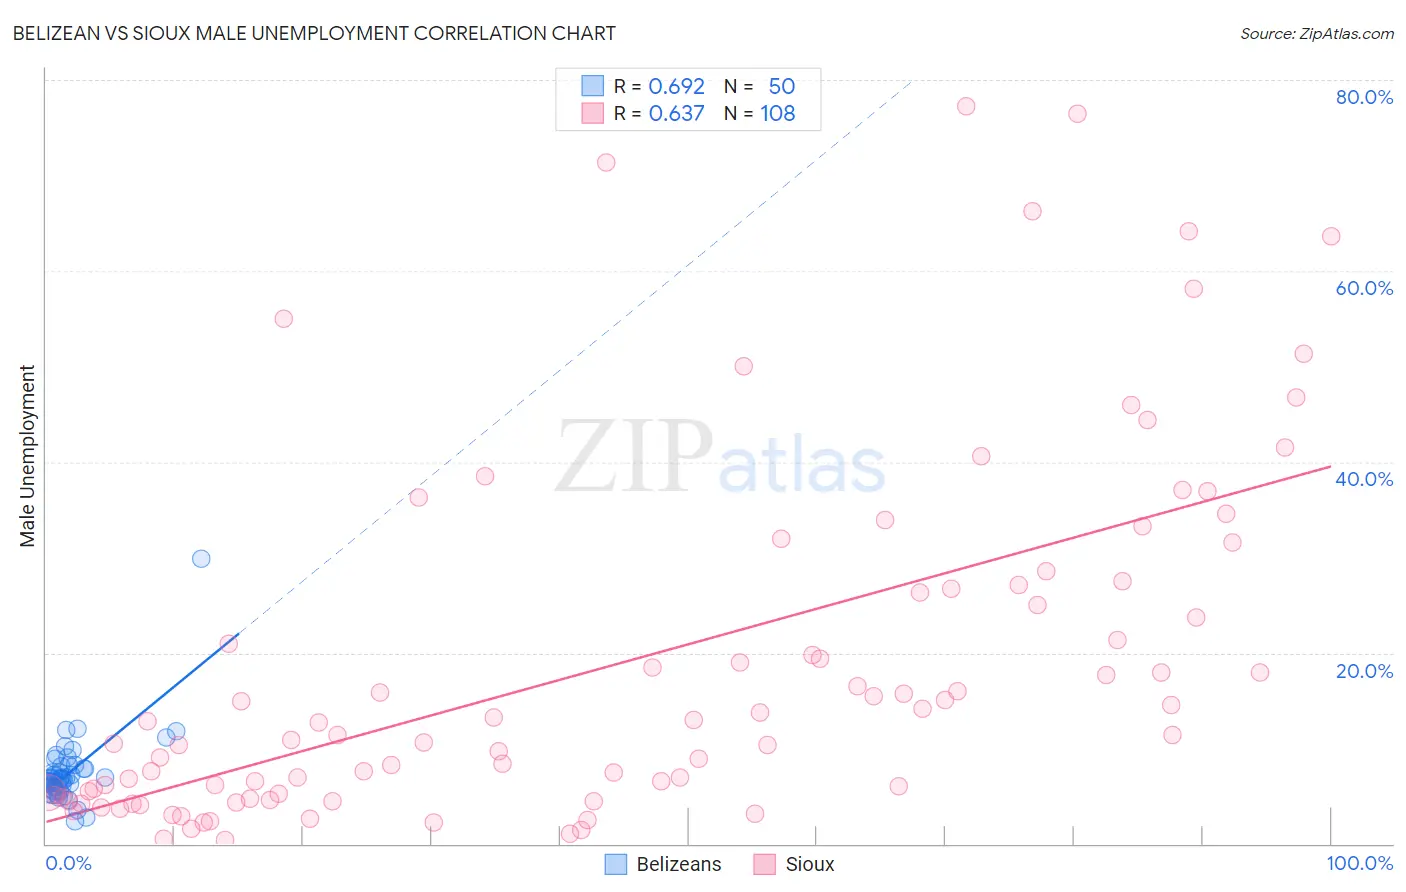
Belizean vs Sioux Male Unemployment Correlation Chart
The statistical analysis conducted on geographies consisting of 144,079,260 people shows a significant positive correlation between the proportion of Belizeans and unemployment rate among males in the United States with a correlation coefficient (R) of 0.692 and weighted average of 6.5%. Similarly, the statistical analysis conducted on geographies consisting of 232,900,714 people shows a significant positive correlation between the proportion of Sioux and unemployment rate among males in the United States with a correlation coefficient (R) of 0.637 and weighted average of 8.4%, a difference of 28.9%.
Male Unemployment Correlation Summary
| Measurement | Belizean | Sioux |
| Minimum | 2.3% | 0.40% |
| Maximum | 29.9% | 77.3% |
| Range | 27.6% | 76.9% |
| Mean | 7.5% | 18.8% |
| Median | 6.8% | 12.1% |
| Interquartile 25% (IQ1) | 5.8% | 5.1% |
| Interquartile 75% (IQ3) | 8.1% | 26.9% |
| Interquartile Range (IQR) | 2.2% | 21.8% |
| Standard Deviation (Sample) | 3.9% | 18.6% |
| Standard Deviation (Population) | 3.8% | 18.5% |
Similar Demographics by Male Unemployment
Demographics Similar to Belizeans by Male Unemployment
In terms of male unemployment, the demographic groups most similar to Belizeans are Immigrants from Haiti (6.5%, a difference of 0.45%), Chippewa (6.6%, a difference of 0.77%), Senegalese (6.4%, a difference of 0.85%), Jamaican (6.6%, a difference of 0.85%), and Haitian (6.4%, a difference of 0.96%).
| Demographics | Rating | Rank | Male Unemployment |
| Immigrants | Senegal | 0.0 /100 | #288 | Tragic 6.3% |
| Immigrants | Caribbean | 0.0 /100 | #289 | Tragic 6.3% |
| U.S. Virgin Islanders | 0.0 /100 | #290 | Tragic 6.4% |
| Immigrants | Azores | 0.0 /100 | #291 | Tragic 6.4% |
| Nepalese | 0.0 /100 | #292 | Tragic 6.4% |
| Haitians | 0.0 /100 | #293 | Tragic 6.4% |
| Senegalese | 0.0 /100 | #294 | Tragic 6.4% |
| Belizeans | 0.0 /100 | #295 | Tragic 6.5% |
| Immigrants | Haiti | 0.0 /100 | #296 | Tragic 6.5% |
| Chippewa | 0.0 /100 | #297 | Tragic 6.6% |
| Jamaicans | 0.0 /100 | #298 | Tragic 6.6% |
| Immigrants | Bangladesh | 0.0 /100 | #299 | Tragic 6.6% |
| Vietnamese | 0.0 /100 | #300 | Tragic 6.6% |
| Immigrants | Belize | 0.0 /100 | #301 | Tragic 6.6% |
| Ute | 0.0 /100 | #302 | Tragic 6.6% |
Demographics Similar to Sioux by Male Unemployment
In terms of male unemployment, the demographic groups most similar to Sioux are Tsimshian (8.5%, a difference of 0.97%), Pueblo (8.5%, a difference of 1.0%), Pima (8.3%, a difference of 1.3%), Yuman (8.6%, a difference of 2.4%), and Puerto Rican (8.6%, a difference of 2.5%).
| Demographics | Rating | Rank | Male Unemployment |
| Immigrants | Dominican Republic | 0.0 /100 | #326 | Tragic 7.6% |
| Paiute | 0.0 /100 | #327 | Tragic 7.7% |
| Natives/Alaskans | 0.0 /100 | #328 | Tragic 7.7% |
| Immigrants | Yemen | 0.0 /100 | #329 | Tragic 7.8% |
| Yakama | 0.0 /100 | #330 | Tragic 7.9% |
| Alaska Natives | 0.0 /100 | #331 | Tragic 8.1% |
| Pima | 0.0 /100 | #332 | Tragic 8.3% |
| Sioux | 0.0 /100 | #333 | Tragic 8.4% |
| Tsimshian | 0.0 /100 | #334 | Tragic 8.5% |
| Pueblo | 0.0 /100 | #335 | Tragic 8.5% |
| Yuman | 0.0 /100 | #336 | Tragic 8.6% |
| Puerto Ricans | 0.0 /100 | #337 | Tragic 8.6% |
| Apache | 0.0 /100 | #338 | Tragic 8.6% |
| Cheyenne | 0.0 /100 | #339 | Tragic 9.8% |
| Alaskan Athabascans | 0.0 /100 | #340 | Tragic 9.8% |