Belgian vs Immigrants from Pakistan Unemployment Among Women with Children Under 6 years
COMPARE
Belgian
Immigrants from Pakistan
Unemployment Among Women with Children Under 6 years
Unemployment Among Women with Children Under 6 years Comparison
Belgians
Immigrants from Pakistan
7.6%
UNEMPLOYMENT AMONG WOMEN WITH CHILDREN UNDER 6 YEARS
63.5/ 100
METRIC RATING
166th/ 347
METRIC RANK
7.2%
UNEMPLOYMENT AMONG WOMEN WITH CHILDREN UNDER 6 YEARS
97.2/ 100
METRIC RATING
106th/ 347
METRIC RANK
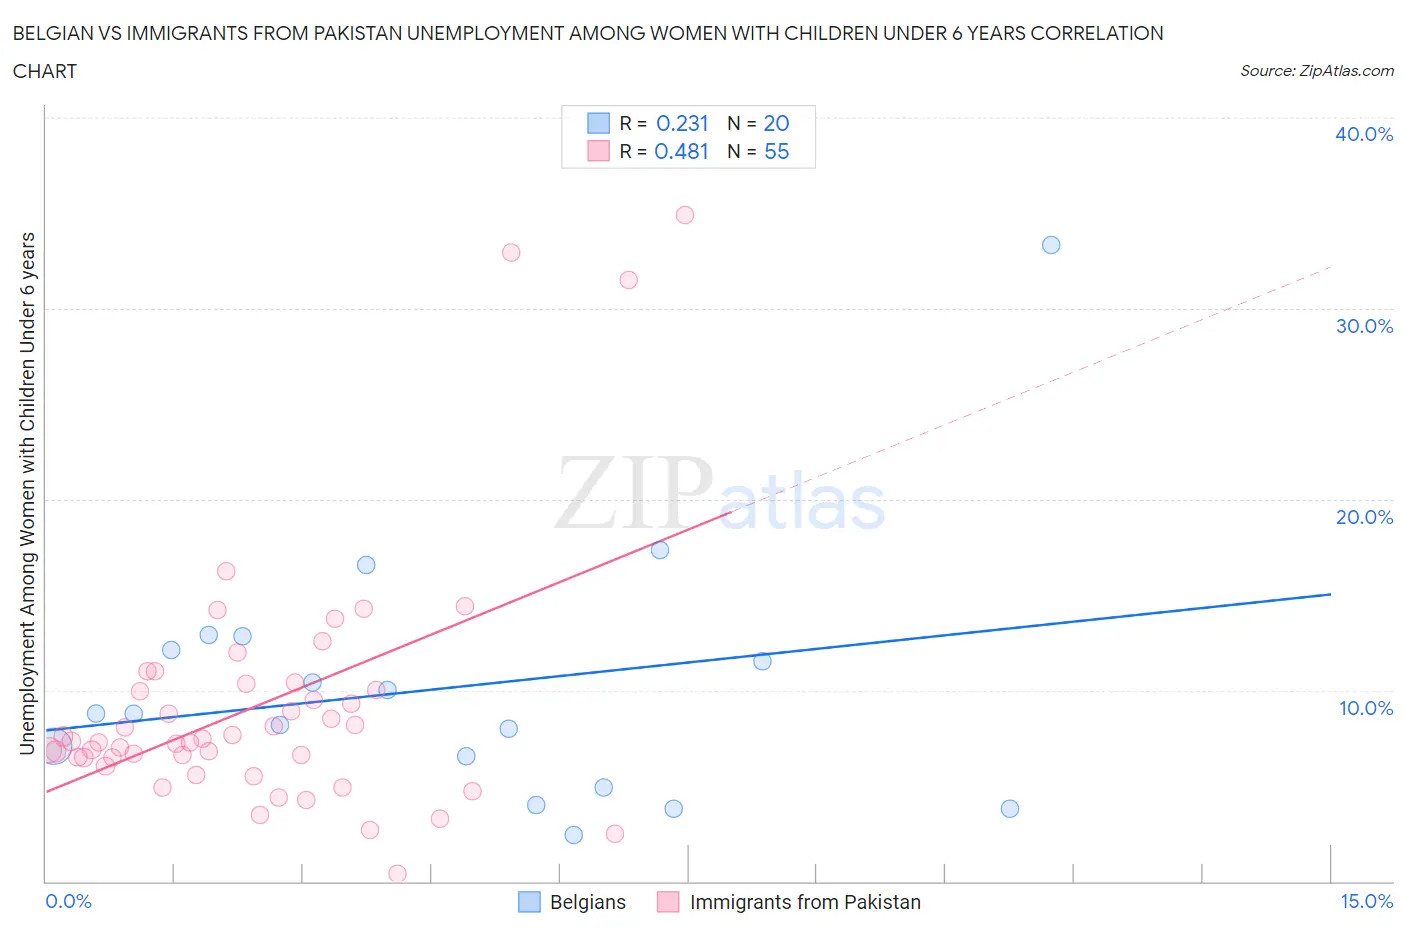
Belgian vs Immigrants from Pakistan Unemployment Among Women with Children Under 6 years Correlation Chart
The statistical analysis conducted on geographies consisting of 265,159,177 people shows a weak positive correlation between the proportion of Belgians and unemployment rate among women with children under the age of 6 in the United States with a correlation coefficient (R) of 0.231 and weighted average of 7.6%. Similarly, the statistical analysis conducted on geographies consisting of 233,137,568 people shows a moderate positive correlation between the proportion of Immigrants from Pakistan and unemployment rate among women with children under the age of 6 in the United States with a correlation coefficient (R) of 0.481 and weighted average of 7.2%, a difference of 5.2%.
Unemployment Among Women with Children Under 6 years Correlation Summary
| Measurement | Belgian | Immigrants from Pakistan |
| Minimum | 2.4% | 0.40% |
| Maximum | 33.3% | 34.9% |
| Range | 30.9% | 34.5% |
| Mean | 10.2% | 9.2% |
| Median | 8.8% | 7.3% |
| Interquartile 25% (IQ1) | 5.7% | 6.5% |
| Interquartile 75% (IQ3) | 12.5% | 10.3% |
| Interquartile Range (IQR) | 6.7% | 3.8% |
| Standard Deviation (Sample) | 6.8% | 6.6% |
| Standard Deviation (Population) | 6.7% | 6.6% |
Similar Demographics by Unemployment Among Women with Children Under 6 years
Demographics Similar to Belgians by Unemployment Among Women with Children Under 6 years
In terms of unemployment among women with children under 6 years, the demographic groups most similar to Belgians are Kenyan (7.6%, a difference of 0.070%), Immigrants from Canada (7.6%, a difference of 0.14%), Immigrants from South America (7.6%, a difference of 0.15%), Immigrants from Scotland (7.6%, a difference of 0.15%), and Ugandan (7.6%, a difference of 0.17%).
| Demographics | Rating | Rank | Unemployment Among Women with Children Under 6 years |
| Immigrants | Philippines | 71.3 /100 | #159 | Good 7.5% |
| Bolivians | 70.8 /100 | #160 | Good 7.5% |
| Immigrants | Western Asia | 70.2 /100 | #161 | Good 7.5% |
| Immigrants | Lithuania | 68.8 /100 | #162 | Good 7.5% |
| British | 66.3 /100 | #163 | Good 7.6% |
| Ugandans | 65.8 /100 | #164 | Good 7.6% |
| Immigrants | South America | 65.6 /100 | #165 | Good 7.6% |
| Belgians | 63.5 /100 | #166 | Good 7.6% |
| Kenyans | 62.5 /100 | #167 | Good 7.6% |
| Immigrants | Canada | 61.6 /100 | #168 | Good 7.6% |
| Immigrants | Scotland | 61.3 /100 | #169 | Good 7.6% |
| Czechs | 59.8 /100 | #170 | Average 7.6% |
| Immigrants | Grenada | 59.0 /100 | #171 | Average 7.6% |
| Immigrants | North America | 57.7 /100 | #172 | Average 7.6% |
| Cree | 51.6 /100 | #173 | Average 7.6% |
Demographics Similar to Immigrants from Pakistan by Unemployment Among Women with Children Under 6 years
In terms of unemployment among women with children under 6 years, the demographic groups most similar to Immigrants from Pakistan are Venezuelan (7.2%, a difference of 0.010%), Immigrants from Kazakhstan (7.2%, a difference of 0.020%), Immigrants from Egypt (7.2%, a difference of 0.030%), Immigrants from Saudi Arabia (7.2%, a difference of 0.10%), and Immigrants from Nicaragua (7.2%, a difference of 0.11%).
| Demographics | Rating | Rank | Unemployment Among Women with Children Under 6 years |
| Immigrants | Europe | 97.5 /100 | #99 | Exceptional 7.2% |
| Immigrants | Northern Europe | 97.4 /100 | #100 | Exceptional 7.2% |
| Chileans | 97.4 /100 | #101 | Exceptional 7.2% |
| Immigrants | Nicaragua | 97.3 /100 | #102 | Exceptional 7.2% |
| Immigrants | Saudi Arabia | 97.3 /100 | #103 | Exceptional 7.2% |
| Immigrants | Egypt | 97.2 /100 | #104 | Exceptional 7.2% |
| Venezuelans | 97.2 /100 | #105 | Exceptional 7.2% |
| Immigrants | Pakistan | 97.2 /100 | #106 | Exceptional 7.2% |
| Immigrants | Kazakhstan | 97.1 /100 | #107 | Exceptional 7.2% |
| Eastern Europeans | 96.9 /100 | #108 | Exceptional 7.2% |
| Australians | 96.9 /100 | #109 | Exceptional 7.2% |
| Palestinians | 96.8 /100 | #110 | Exceptional 7.2% |
| Norwegians | 96.7 /100 | #111 | Exceptional 7.2% |
| Israelis | 96.5 /100 | #112 | Exceptional 7.2% |
| Nicaraguans | 96.3 /100 | #113 | Exceptional 7.2% |