Belgian vs Immigrants from Grenada Unemployment Among Ages 25 to 29 years
COMPARE
Belgian
Immigrants from Grenada
Unemployment Among Ages 25 to 29 years
Unemployment Among Ages 25 to 29 years Comparison
Belgians
Immigrants from Grenada
6.3%
UNEMPLOYMENT AMONG AGES 25 TO 29 YEARS
97.0/ 100
METRIC RATING
73rd/ 347
METRIC RANK
8.4%
UNEMPLOYMENT AMONG AGES 25 TO 29 YEARS
0.0/ 100
METRIC RATING
316th/ 347
METRIC RANK
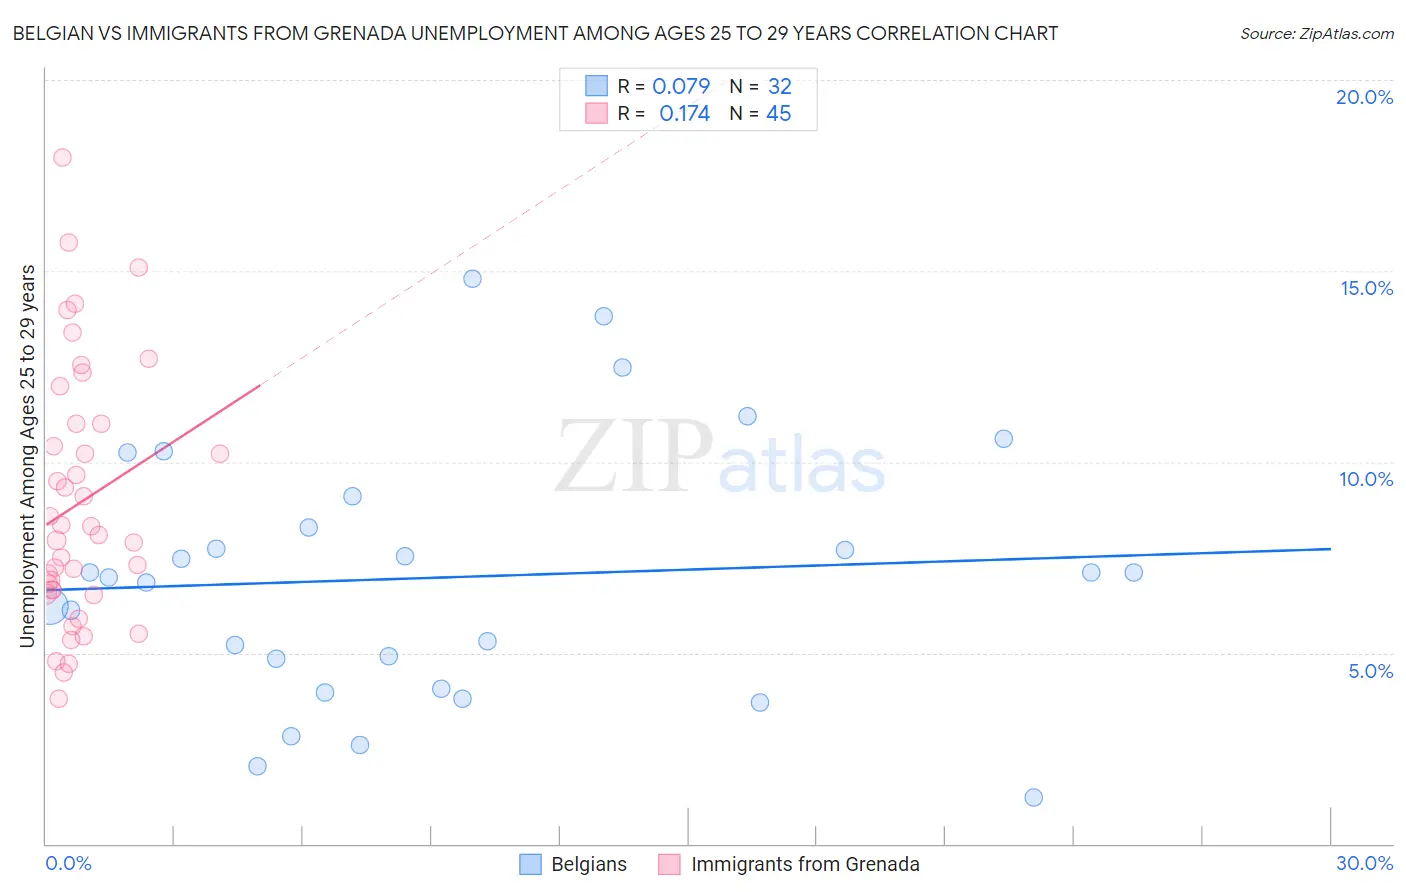
Belgian vs Immigrants from Grenada Unemployment Among Ages 25 to 29 years Correlation Chart
The statistical analysis conducted on geographies consisting of 334,915,695 people shows a slight positive correlation between the proportion of Belgians and unemployment rate among population between the ages 25 and 29 in the United States with a correlation coefficient (R) of 0.079 and weighted average of 6.3%. Similarly, the statistical analysis conducted on geographies consisting of 66,445,528 people shows a poor positive correlation between the proportion of Immigrants from Grenada and unemployment rate among population between the ages 25 and 29 in the United States with a correlation coefficient (R) of 0.174 and weighted average of 8.4%, a difference of 34.2%.
Unemployment Among Ages 25 to 29 years Correlation Summary
| Measurement | Belgian | Immigrants from Grenada |
| Minimum | 1.2% | 3.8% |
| Maximum | 14.8% | 18.0% |
| Range | 13.6% | 14.2% |
| Mean | 7.0% | 8.9% |
| Median | 7.0% | 8.1% |
| Interquartile 25% (IQ1) | 4.4% | 6.6% |
| Interquartile 75% (IQ3) | 8.7% | 11.0% |
| Interquartile Range (IQR) | 4.3% | 4.4% |
| Standard Deviation (Sample) | 3.3% | 3.3% |
| Standard Deviation (Population) | 3.3% | 3.3% |
Similar Demographics by Unemployment Among Ages 25 to 29 years
Demographics Similar to Belgians by Unemployment Among Ages 25 to 29 years
In terms of unemployment among ages 25 to 29 years, the demographic groups most similar to Belgians are Carpatho Rusyn (6.3%, a difference of 0.020%), Immigrants from Jordan (6.3%, a difference of 0.090%), Immigrants from Korea (6.3%, a difference of 0.16%), Icelander (6.3%, a difference of 0.18%), and Scandinavian (6.3%, a difference of 0.25%).
| Demographics | Rating | Rank | Unemployment Among Ages 25 to 29 years |
| Indians (Asian) | 97.8 /100 | #66 | Exceptional 6.3% |
| Immigrants | Northern Africa | 97.8 /100 | #67 | Exceptional 6.3% |
| Palestinians | 97.7 /100 | #68 | Exceptional 6.3% |
| Immigrants | Hong Kong | 97.5 /100 | #69 | Exceptional 6.3% |
| Immigrants | Malaysia | 97.5 /100 | #70 | Exceptional 6.3% |
| Immigrants | France | 97.4 /100 | #71 | Exceptional 6.3% |
| Scandinavians | 97.4 /100 | #72 | Exceptional 6.3% |
| Belgians | 97.0 /100 | #73 | Exceptional 6.3% |
| Carpatho Rusyns | 96.9 /100 | #74 | Exceptional 6.3% |
| Immigrants | Jordan | 96.8 /100 | #75 | Exceptional 6.3% |
| Immigrants | Korea | 96.7 /100 | #76 | Exceptional 6.3% |
| Icelanders | 96.6 /100 | #77 | Exceptional 6.3% |
| Asians | 96.4 /100 | #78 | Exceptional 6.3% |
| Immigrants | Switzerland | 96.0 /100 | #79 | Exceptional 6.3% |
| Immigrants | Romania | 95.9 /100 | #80 | Exceptional 6.3% |
Demographics Similar to Immigrants from Grenada by Unemployment Among Ages 25 to 29 years
In terms of unemployment among ages 25 to 29 years, the demographic groups most similar to Immigrants from Grenada are British West Indian (8.4%, a difference of 0.070%), Immigrants from Guyana (8.5%, a difference of 0.090%), Guyanese (8.5%, a difference of 0.35%), Immigrants from Armenia (8.5%, a difference of 0.57%), and Immigrants from Dominica (8.4%, a difference of 0.66%).
| Demographics | Rating | Rank | Unemployment Among Ages 25 to 29 years |
| Immigrants | Haiti | 0.0 /100 | #309 | Tragic 8.1% |
| U.S. Virgin Islanders | 0.0 /100 | #310 | Tragic 8.1% |
| Immigrants | Azores | 0.0 /100 | #311 | Tragic 8.1% |
| Dutch West Indians | 0.0 /100 | #312 | Tragic 8.2% |
| Immigrants | St. Vincent and the Grenadines | 0.0 /100 | #313 | Tragic 8.4% |
| Immigrants | Dominica | 0.0 /100 | #314 | Tragic 8.4% |
| British West Indians | 0.0 /100 | #315 | Tragic 8.4% |
| Immigrants | Grenada | 0.0 /100 | #316 | Tragic 8.4% |
| Immigrants | Guyana | 0.0 /100 | #317 | Tragic 8.5% |
| Guyanese | 0.0 /100 | #318 | Tragic 8.5% |
| Immigrants | Armenia | 0.0 /100 | #319 | Tragic 8.5% |
| Blacks/African Americans | 0.0 /100 | #320 | Tragic 8.6% |
| Immigrants | Dominican Republic | 0.0 /100 | #321 | Tragic 8.6% |
| Tlingit-Haida | 0.0 /100 | #322 | Tragic 8.7% |
| Dominicans | 0.0 /100 | #323 | Tragic 8.7% |