Australian vs Pakistani Unemployment Among Ages 35 to 44 years

COMPARE

Australian
Race
Ancestry
AfghanAfricanAlaska NativeAlaskan AthabascanAlbanianAleutAlsatianAmericanApacheArabArapahoArgentineanArmenianAssyrian/Chaldean/SyriacAustralianAustrianBahamianBangladeshiBarbadianBasqueBelgianBelizeanBermudanBhutaneseBlackfeetBolivianBrazilianBritishBritish West IndianBulgarianBurmeseCajunCambodianCanadianCape VerdeanCarpatho RusynCelticCentral AmericanCentral American IndianCherokeeCheyenneChickasawChileanChineseChippewaChoctawColombianColvilleComancheCosta RicanCreeCreekCroatianCrowCubanCypriotCzechCzechoslovakianDanishDelawareDominicanDutchDutch West IndianEastern EuropeanEcuadorianEgyptianEnglishEstonianEthiopianEuropeanFijianFilipinoFinnishFrenchFrench American IndianFrench CanadianGermanGerman RussianGhanaianGreekGuamanian/ChamorroGuatemalanGuyaneseHaitianHmongHonduranHopiHoumaHungarianIcelanderIndian (Asian)IndonesianInupiatIranianIraqiIrishIroquoisIsraeliItalianJamaicanJapaneseJordanianKenyanKiowaKoreanLaotianLatvianLebaneseLiberianLithuanianLumbeeLuxembourgerMacedonianMalaysianMalteseMarshalleseMenomineeMexicanMexican American IndianMongolianMoroccanNative HawaiianNavajoNepaleseNew ZealanderNicaraguanNigerianNorthern EuropeanNorwegianOkinawanOsageOttawaPaiutePalestinianPanamanianParaguayanPennsylvania GermanPeruvianPimaPolishPortuguesePotawatomiPuebloPuerto RicanPuget Sound SalishRomanianRussianSalvadoranSamoanScandinavianScotch-IrishScottishSeminoleSenegaleseSerbianShoshoneSierra LeoneanSiouxSlavicSlovakSloveneSomaliSouth AfricanSouth AmericanSouth American IndianSoviet UnionSpaniardSpanishSpanish AmericanSpanish American IndianSri LankanSubsaharan AfricanSudaneseSwedishSwissSyrianTaiwaneseThaiTlingit-HaidaTohono O'OdhamTonganTrinidadian and TobagonianTsimshianTurkishU.S. Virgin IslanderUgandanUkrainianUruguayanUteVenezuelanVietnameseWelshWest IndianYakamaYaquiYugoslavianYumanYup'ikZimbabwean
Immigration
NonimmigrantsImmigrantsAfghanistanAfricaAlbaniaArgentinaArmeniaAsiaAustraliaAustriaBahamasBangladeshBarbadosBelarusBelgiumBelizeBoliviaBosnia and HerzegovinaBrazilBulgariaBurma/MyanmarCabo VerdeCambodiaCameroonCanadaCaribbeanCentral AmericaChileChinaColombiaCongoCosta RicaCroatiaCubaCzechoslovakiaDenmarkDominicaDominican RepublicEastern AfricaEastern AsiaEastern EuropeEcuadorEgyptEl SalvadorEnglandEritreaEthiopiaEuropeFijiFranceGermanyGhanaGreeceGrenadaGuatemalaGuyanaHaitiHondurasHong KongHungaryIndiaIndonesiaIranIraqIrelandIsraelItalyJamaicaJapanJordanKazakhstanKenyaKoreaKuwaitLaosLatin AmericaLatviaLebanonLiberiaLithuaniaMalaysiaMexicoMicronesiaMiddle AfricaMoldovaMoroccoNepalNetherlandsNicaraguaNigeriaNorth AmericaNorth MacedoniaNorthern AfricaNorthern EuropeNorwayOceaniaPakistanPanamaPeruPhilippinesPolandPortugalRomaniaRussiaSaudi ArabiaScotlandSenegalSerbiaSierra LeoneSingaporeSomaliaSouth AfricaSouth AmericaSouth Central AsiaSouth Eastern AsiaSouthern EuropeSpainSri LankaSt. Vincent and the GrenadinesSudanSwedenSwitzerlandSyriaTaiwanThailandTrinidad and TobagoTurkeyUgandaUkraineUruguayUzbekistanVenezuelaVietnamWest IndiesWestern AfricaWestern AsiaWestern EuropeYemenZaireZimbabweAzores
Pakistani
Race
Ancestry
AfghanAfricanAlaska NativeAlaskan AthabascanAlbanianAleutAlsatianAmericanApacheArabArapahoArgentineanArmenianAssyrian/Chaldean/SyriacAustrianBahamianBangladeshiBarbadianBasqueBelgianBelizeanBermudanBhutaneseBlackfeetBolivianBrazilianBritishBritish West IndianBulgarianBurmeseCajunCambodianCanadianCape VerdeanCarpatho RusynCelticCentral AmericanCentral American IndianCherokeeCheyenneChickasawChileanChineseChippewaChoctawColombianColvilleComancheCosta RicanCreeCreekCroatianCrowCubanCypriotCzechCzechoslovakianDanishDelawareDominicanDutchDutch West IndianEastern EuropeanEcuadorianEgyptianEnglishEstonianEthiopianEuropeanFijianFilipinoFinnishFrenchFrench American IndianFrench CanadianGermanGerman RussianGhanaianGreekGuamanian/ChamorroGuatemalanGuyaneseHaitianHmongHonduranHopiHoumaHungarianIcelanderIndian (Asian)IndonesianInupiatIranianIraqiIrishIroquoisIsraeliItalianJamaicanJapaneseJordanianKenyanKiowaKoreanLaotianLatvianLebaneseLiberianLithuanianLumbeeLuxembourgerMacedonianMalaysianMalteseMarshalleseMenomineeMexicanMexican American IndianMongolianMoroccanNative HawaiianNavajoNepaleseNew ZealanderNicaraguanNigerianNorthern EuropeanNorwegianOkinawanOsageOttawaPaiutePakistaniPalestinianPanamanianParaguayanPennsylvania GermanPeruvianPimaPolishPortuguesePotawatomiPuebloPuerto RicanPuget Sound SalishRomanianRussianSalvadoranSamoanScandinavianScotch-IrishScottishSeminoleSenegaleseSerbianShoshoneSierra LeoneanSiouxSlavicSlovakSloveneSomaliSouth AfricanSouth AmericanSouth American IndianSoviet UnionSpaniardSpanishSpanish AmericanSpanish American IndianSri LankanSubsaharan AfricanSudaneseSwedishSwissSyrianTaiwaneseThaiTlingit-HaidaTohono O'OdhamTonganTrinidadian and TobagonianTsimshianTurkishU.S. Virgin IslanderUgandanUkrainianUruguayanUteVenezuelanVietnameseWelshWest IndianYakamaYaquiYugoslavianYumanYup'ikZimbabwean
Immigration
NonimmigrantsImmigrantsAfghanistanAfricaAlbaniaArgentinaArmeniaAsiaAustraliaAustriaBahamasBangladeshBarbadosBelarusBelgiumBelizeBoliviaBosnia and HerzegovinaBrazilBulgariaBurma/MyanmarCabo VerdeCambodiaCameroonCanadaCaribbeanCentral AmericaChileChinaColombiaCongoCosta RicaCroatiaCubaCzechoslovakiaDenmarkDominicaDominican RepublicEastern AfricaEastern AsiaEastern EuropeEcuadorEgyptEl SalvadorEnglandEritreaEthiopiaEuropeFijiFranceGermanyGhanaGreeceGrenadaGuatemalaGuyanaHaitiHondurasHong KongHungaryIndiaIndonesiaIranIraqIrelandIsraelItalyJamaicaJapanJordanKazakhstanKenyaKoreaKuwaitLaosLatin AmericaLatviaLebanonLiberiaLithuaniaMalaysiaMexicoMicronesiaMiddle AfricaMoldovaMoroccoNepalNetherlandsNicaraguaNigeriaNorth AmericaNorth MacedoniaNorthern AfricaNorthern EuropeNorwayOceaniaPakistanPanamaPeruPhilippinesPolandPortugalRomaniaRussiaSaudi ArabiaScotlandSenegalSerbiaSierra LeoneSingaporeSomaliaSouth AfricaSouth AmericaSouth Central AsiaSouth Eastern AsiaSouthern EuropeSpainSri LankaSt. Vincent and the GrenadinesSudanSwedenSwitzerlandSyriaTaiwanThailandTrinidad and TobagoTurkeyUgandaUkraineUruguayUzbekistanVenezuelaVietnamWest IndiesWestern AfricaWestern AsiaWestern EuropeYemenZaireZimbabweAzores
Unemployment Among Ages 35 to 44 years
Income
Poverty
Unemployment
Labor Participation
Family Structure
Vehicle Availability
Education Level
Disability

Unemployment Among Ages 35 to 44 years Comparison

Australians

Pakistanis

Exceptional
Good
4.5%
UNEMPLOYMENT AMONG AGES 35 TO 44 YEARS
94.5/ 100
METRIC RATING
90th/ 347
METRIC RANK
4.6%
UNEMPLOYMENT AMONG AGES 35 TO 44 YEARS
67.1/ 100
METRIC RATING
152nd/ 347
METRIC RANK

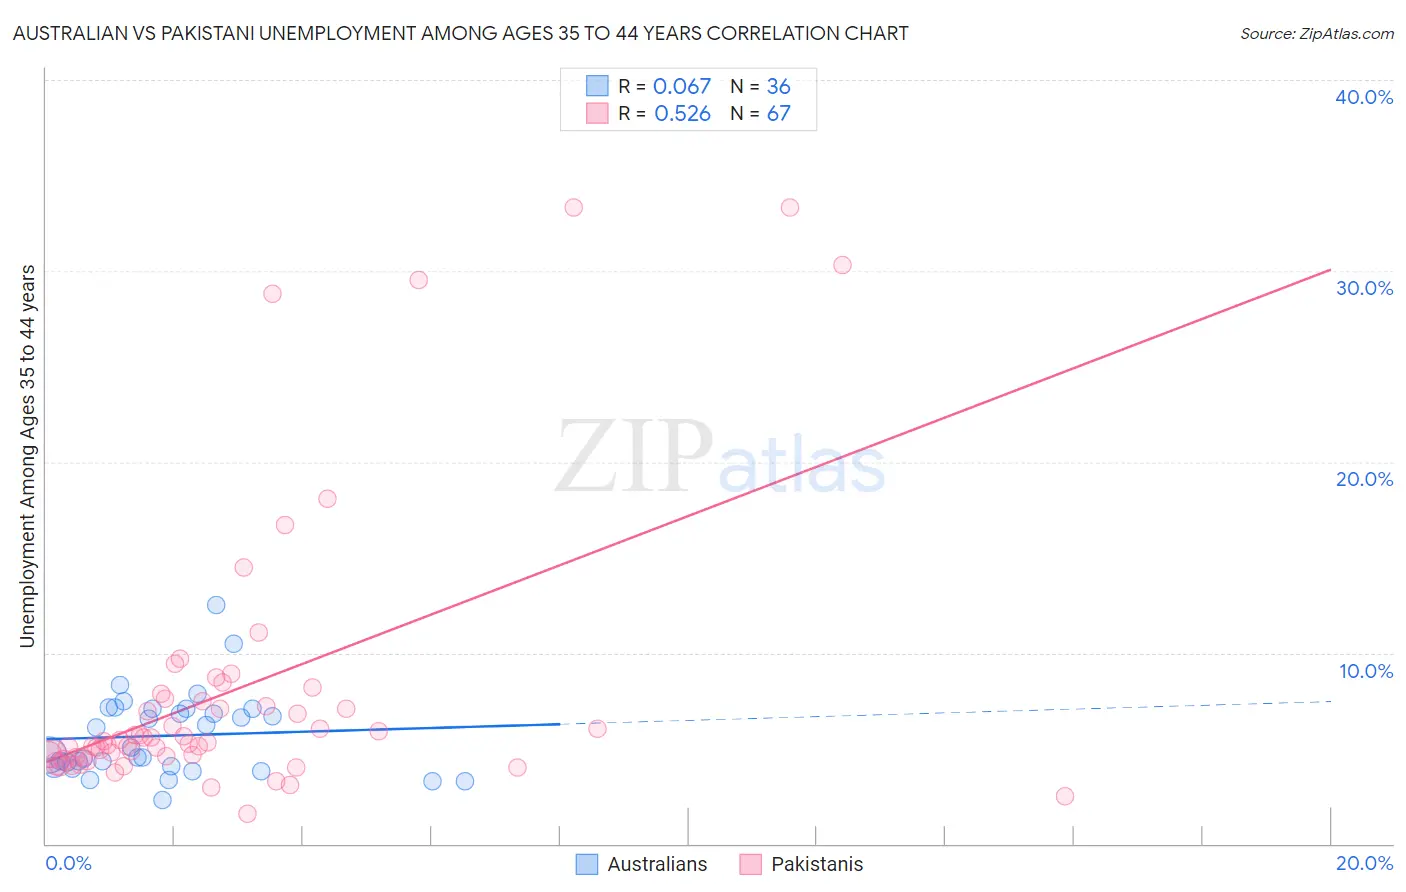
Australian vs Pakistani Unemployment Among Ages 35 to 44 years Correlation Chart

The statistical analysis conducted on geographies consisting of 220,770,774 people shows a slight positive correlation between the proportion of Australians and unemployment rate among population between the ages 35 and 44 in the United States with a correlation coefficient (R) of 0.067 and weighted average of 4.5%. Similarly, the statistical analysis conducted on geographies consisting of 330,188,758 people shows a substantial positive correlation between the proportion of Pakistanis and unemployment rate among population between the ages 35 and 44 in the United States with a correlation coefficient (R) of 0.526 and weighted average of 4.6%, a difference of 4.0%.
Australian vs Pakistani Unemployment Among Ages 35 to 44 years

Unemployment Among Ages 35 to 44 years Correlation Summary

MeasurementAustralianPakistani
Minimum2.3%1.6%
Maximum12.5%33.3%
Range10.2%31.7%
Mean5.7%8.0%
Median4.9%5.4%
Interquartile 25% (IQ1)4.0%4.5%
Interquartile 75% (IQ3)7.1%7.6%
Interquartile Range (IQR)3.0%3.0%
Standard Deviation (Sample)2.2%7.2%
Standard Deviation (Population)2.1%7.2%

Similar Demographics by Unemployment Among Ages 35 to 44 years

Demographics Similar to Australians by Unemployment Among Ages 35 to 44 years

In terms of unemployment among ages 35 to 44 years, the demographic groups most similar to Australians are Egyptian (4.5%, a difference of 0.020%), Immigrants from Northern Europe (4.5%, a difference of 0.070%), Estonian (4.5%, a difference of 0.080%), Immigrants from Latvia (4.4%, a difference of 0.11%), and Immigrants from Bosnia and Herzegovina (4.4%, a difference of 0.12%).
DemographicsRating | RankUnemployment Among Ages 35 to 44 years
Immigrants | Australia
95.3
/100
|
#83
Exceptional
4.4%
Immigrants | Chile
95.2
/100
|
#84
Exceptional
4.4%
Immigrants | Kenya
95.0
/100
|
#85
Exceptional
4.4%
Serbians
94.9
/100
|
#86
Exceptional
4.4%
Immigrants | Bosnia and Herzegovina
94.8
/100
|
#87
Exceptional
4.4%
Immigrants | Latvia
94.8
/100
|
#88
Exceptional
4.4%
Egyptians
94.5
/100
|
#89
Exceptional
4.5%
Australians
94.5
/100
|
#90
Exceptional
4.5%
Immigrants | Northern Europe
94.3
/100
|
#91
Exceptional
4.5%
Estonians
94.3
/100
|
#92
Exceptional
4.5%
Iranians
93.9
/100
|
#93
Exceptional
4.5%
Russians
93.8
/100
|
#94
Exceptional
4.5%
Yugoslavians
93.6
/100
|
#95
Exceptional
4.5%
Scottish
93.5
/100
|
#96
Exceptional
4.5%
Immigrants | France
92.5
/100
|
#97
Exceptional
4.5%

Demographics Similar to Pakistanis by Unemployment Among Ages 35 to 44 years

In terms of unemployment among ages 35 to 44 years, the demographic groups most similar to Pakistanis are Puget Sound Salish (4.6%, a difference of 0.0%), Immigrants from Brazil (4.6%, a difference of 0.010%), Immigrants from Western Europe (4.6%, a difference of 0.13%), White/Caucasian (4.6%, a difference of 0.18%), and South American (4.6%, a difference of 0.27%).
DemographicsRating | RankUnemployment Among Ages 35 to 44 years
Immigrants | Eastern Europe
74.7
/100
|
#145
Good
4.6%
Immigrants | Denmark
74.4
/100
|
#146
Good
4.6%
Immigrants | Vietnam
73.8
/100
|
#147
Good
4.6%
Slavs
72.4
/100
|
#148
Good
4.6%
Immigrants | Burma/Myanmar
72.2
/100
|
#149
Good
4.6%
Immigrants | England
70.5
/100
|
#150
Good
4.6%
Puget Sound Salish
67.1
/100
|
#151
Good
4.6%
Pakistanis
67.1
/100
|
#152
Good
4.6%
Immigrants | Brazil
67.0
/100
|
#153
Good
4.6%
Immigrants | Western Europe
65.5
/100
|
#154
Good
4.6%
Whites/Caucasians
64.9
/100
|
#155
Good
4.6%
South Americans
63.7
/100
|
#156
Good
4.6%
Immigrants | Belarus
63.4
/100
|
#157
Good
4.6%
Immigrants | Iran
63.1
/100
|
#158
Good
4.6%
Albanians
63.0
/100
|
#159
Good
4.6%