Asian vs Lebanese Unemployment Among Ages 55 to 59 years

COMPARE

Asian
Race
Ancestry
AfghanAfricanAlaska NativeAlaskan AthabascanAlbanianAleutAlsatianAmericanApacheArabArapahoArgentineanArmenianAssyrian/Chaldean/SyriacAustralianAustrianBahamianBangladeshiBarbadianBasqueBelgianBelizeanBermudanBhutaneseBlackfeetBolivianBrazilianBritishBritish West IndianBulgarianBurmeseCajunCambodianCanadianCape VerdeanCarpatho RusynCelticCentral AmericanCentral American IndianCherokeeCheyenneChickasawChileanChineseChippewaChoctawColombianColvilleComancheCosta RicanCreeCreekCroatianCrowCubanCypriotCzechCzechoslovakianDanishDelawareDominicanDutchDutch West IndianEastern EuropeanEcuadorianEgyptianEnglishEstonianEthiopianEuropeanFijianFilipinoFinnishFrenchFrench American IndianFrench CanadianGermanGerman RussianGhanaianGreekGuamanian/ChamorroGuatemalanGuyaneseHaitianHmongHonduranHopiHoumaHungarianIcelanderIndian (Asian)IndonesianInupiatIranianIraqiIrishIroquoisIsraeliItalianJamaicanJapaneseJordanianKenyanKiowaKoreanLaotianLatvianLiberianLithuanianLumbeeLuxembourgerMacedonianMalaysianMalteseMarshalleseMenomineeMexicanMexican American IndianMongolianMoroccanNative HawaiianNavajoNepaleseNew ZealanderNicaraguanNigerianNorthern EuropeanNorwegianOkinawanOsageOttawaPaiutePakistaniPalestinianPanamanianParaguayanPennsylvania GermanPeruvianPimaPolishPortuguesePotawatomiPuebloPuerto RicanPuget Sound SalishRomanianRussianSalvadoranSamoanScandinavianScotch-IrishScottishSeminoleSenegaleseSerbianShoshoneSierra LeoneanSiouxSlavicSlovakSloveneSomaliSouth AfricanSouth AmericanSouth American IndianSoviet UnionSpaniardSpanishSpanish AmericanSpanish American IndianSri LankanSubsaharan AfricanSudaneseSwedishSwissSyrianTaiwaneseThaiTlingit-HaidaTohono O'OdhamTonganTrinidadian and TobagonianTsimshianTurkishU.S. Virgin IslanderUgandanUkrainianUruguayanUteVenezuelanVietnameseWelshWest IndianYakamaYaquiYugoslavianYumanYup'ikZimbabwean
Immigration
NonimmigrantsImmigrantsAfghanistanAfricaAlbaniaArgentinaArmeniaAsiaAustraliaAustriaBahamasBangladeshBarbadosBelarusBelgiumBelizeBoliviaBosnia and HerzegovinaBrazilBulgariaBurma/MyanmarCabo VerdeCambodiaCameroonCanadaCaribbeanCentral AmericaChileChinaColombiaCongoCosta RicaCroatiaCubaCzechoslovakiaDenmarkDominicaDominican RepublicEastern AfricaEastern AsiaEastern EuropeEcuadorEgyptEl SalvadorEnglandEritreaEthiopiaEuropeFijiFranceGermanyGhanaGreeceGrenadaGuatemalaGuyanaHaitiHondurasHong KongHungaryIndiaIndonesiaIranIraqIrelandIsraelItalyJamaicaJapanJordanKazakhstanKenyaKoreaKuwaitLaosLatin AmericaLatviaLebanonLiberiaLithuaniaMalaysiaMexicoMicronesiaMiddle AfricaMoldovaMoroccoNepalNetherlandsNicaraguaNigeriaNorth AmericaNorth MacedoniaNorthern AfricaNorthern EuropeNorwayOceaniaPakistanPanamaPeruPhilippinesPolandPortugalRomaniaRussiaSaudi ArabiaScotlandSenegalSerbiaSierra LeoneSingaporeSomaliaSouth AfricaSouth AmericaSouth Central AsiaSouth Eastern AsiaSouthern EuropeSpainSri LankaSt. Vincent and the GrenadinesSudanSwedenSwitzerlandSyriaTaiwanThailandTrinidad and TobagoTurkeyUgandaUkraineUruguayUzbekistanVenezuelaVietnamWest IndiesWestern AfricaWestern AsiaWestern EuropeYemenZaireZimbabweAzores
Lebanese
Race
Ancestry
AfghanAfricanAlaska NativeAlaskan AthabascanAlbanianAleutAlsatianAmericanApacheArabArapahoArgentineanArmenianAssyrian/Chaldean/SyriacAustralianAustrianBahamianBangladeshiBarbadianBasqueBelgianBelizeanBermudanBhutaneseBlackfeetBolivianBrazilianBritishBritish West IndianBulgarianBurmeseCajunCambodianCanadianCape VerdeanCarpatho RusynCelticCentral AmericanCentral American IndianCherokeeCheyenneChickasawChileanChineseChippewaChoctawColombianColvilleComancheCosta RicanCreeCreekCroatianCrowCubanCypriotCzechCzechoslovakianDanishDelawareDominicanDutchDutch West IndianEastern EuropeanEcuadorianEgyptianEnglishEstonianEthiopianEuropeanFijianFilipinoFinnishFrenchFrench American IndianFrench CanadianGermanGerman RussianGhanaianGreekGuamanian/ChamorroGuatemalanGuyaneseHaitianHmongHonduranHopiHoumaHungarianIcelanderIndian (Asian)IndonesianInupiatIranianIraqiIrishIroquoisIsraeliItalianJamaicanJapaneseJordanianKenyanKiowaKoreanLaotianLatvianLebaneseLiberianLithuanianLumbeeLuxembourgerMacedonianMalaysianMalteseMarshalleseMenomineeMexicanMexican American IndianMongolianMoroccanNative HawaiianNavajoNepaleseNew ZealanderNicaraguanNigerianNorthern EuropeanNorwegianOkinawanOsageOttawaPaiutePakistaniPalestinianPanamanianParaguayanPennsylvania GermanPeruvianPimaPolishPortuguesePotawatomiPuebloPuerto RicanPuget Sound SalishRomanianRussianSalvadoranSamoanScandinavianScotch-IrishScottishSeminoleSenegaleseSerbianShoshoneSierra LeoneanSiouxSlavicSlovakSloveneSomaliSouth AfricanSouth AmericanSouth American IndianSoviet UnionSpaniardSpanishSpanish AmericanSpanish American IndianSri LankanSubsaharan AfricanSudaneseSwedishSwissSyrianTaiwaneseThaiTlingit-HaidaTohono O'OdhamTonganTrinidadian and TobagonianTsimshianTurkishU.S. Virgin IslanderUgandanUkrainianUruguayanUteVenezuelanVietnameseWelshWest IndianYakamaYaquiYugoslavianYumanYup'ikZimbabwean
Immigration
NonimmigrantsImmigrantsAfghanistanAfricaAlbaniaArgentinaArmeniaAsiaAustraliaAustriaBahamasBangladeshBarbadosBelarusBelgiumBelizeBoliviaBosnia and HerzegovinaBrazilBulgariaBurma/MyanmarCabo VerdeCambodiaCameroonCanadaCaribbeanCentral AmericaChileChinaColombiaCongoCosta RicaCroatiaCubaCzechoslovakiaDenmarkDominicaDominican RepublicEastern AfricaEastern AsiaEastern EuropeEcuadorEgyptEl SalvadorEnglandEritreaEthiopiaEuropeFijiFranceGermanyGhanaGreeceGrenadaGuatemalaGuyanaHaitiHondurasHong KongHungaryIndiaIndonesiaIranIraqIrelandIsraelItalyJamaicaJapanJordanKazakhstanKenyaKoreaKuwaitLaosLatin AmericaLatviaLebanonLiberiaLithuaniaMalaysiaMexicoMicronesiaMiddle AfricaMoldovaMoroccoNepalNetherlandsNicaraguaNigeriaNorth AmericaNorth MacedoniaNorthern AfricaNorthern EuropeNorwayOceaniaPakistanPanamaPeruPhilippinesPolandPortugalRomaniaRussiaSaudi ArabiaScotlandSenegalSerbiaSierra LeoneSingaporeSomaliaSouth AfricaSouth AmericaSouth Central AsiaSouth Eastern AsiaSouthern EuropeSpainSri LankaSt. Vincent and the GrenadinesSudanSwedenSwitzerlandSyriaTaiwanThailandTrinidad and TobagoTurkeyUgandaUkraineUruguayUzbekistanVenezuelaVietnamWest IndiesWestern AfricaWestern AsiaWestern EuropeYemenZaireZimbabweAzores
Unemployment Among Ages 55 to 59 years
Income
Poverty
Unemployment
Labor Participation
Family Structure
Vehicle Availability
Education Level
Disability

Unemployment Among Ages 55 to 59 years Comparison

Asians

Lebanese

Exceptional
Exceptional
4.7%
UNEMPLOYMENT AMONG AGES 55 TO 59 YEARS
90.8/ 100
METRIC RATING
117th/ 347
METRIC RANK
4.6%
UNEMPLOYMENT AMONG AGES 55 TO 59 YEARS
97.5/ 100
METRIC RATING
83rd/ 347
METRIC RANK

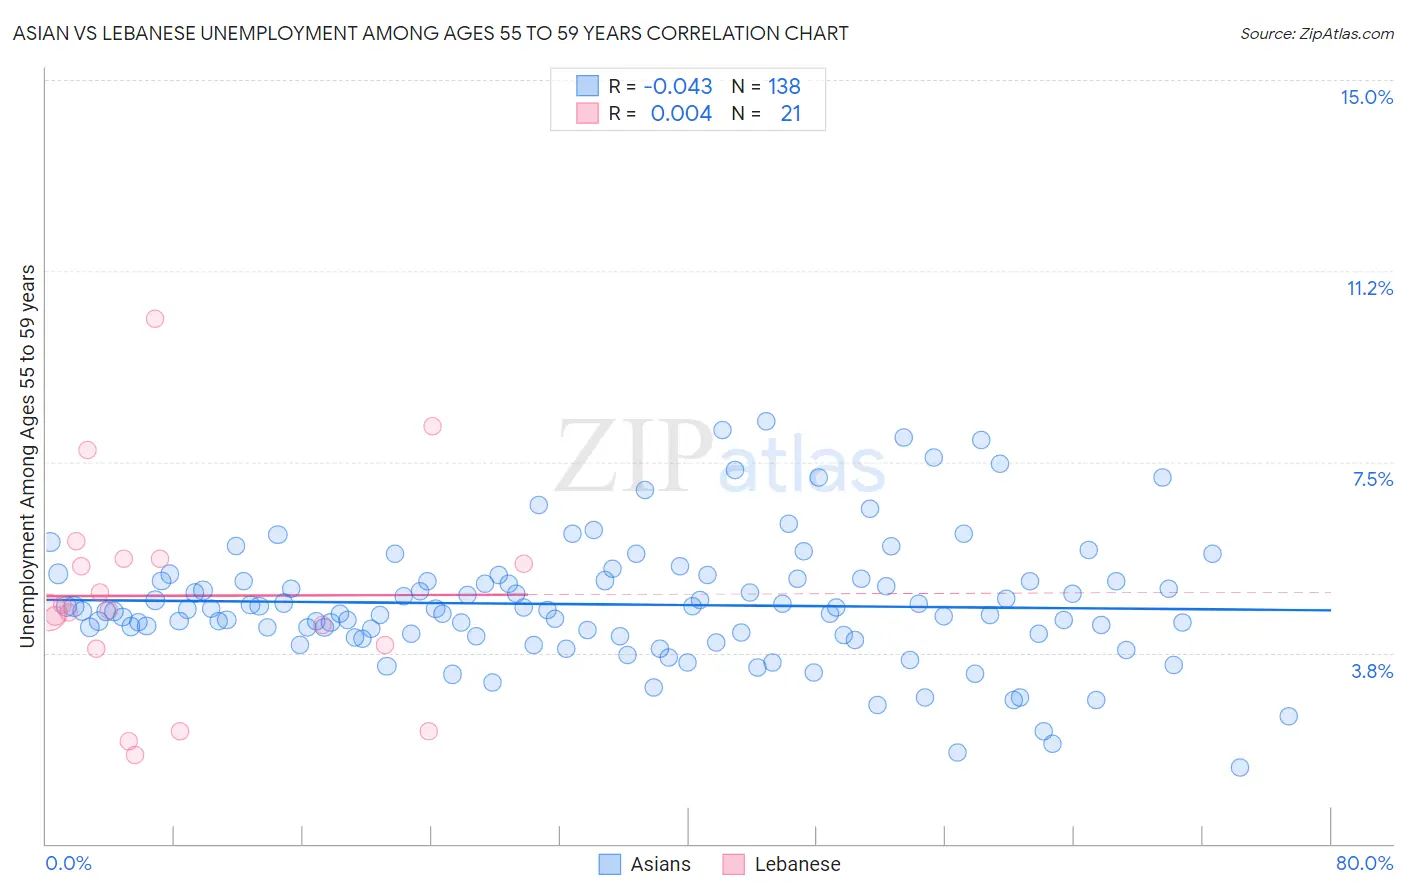
Asian vs Lebanese Unemployment Among Ages 55 to 59 years Correlation Chart

The statistical analysis conducted on geographies consisting of 480,246,453 people shows no correlation between the proportion of Asians and unemployment rate among population between the ages 55 and 59 in the United States with a correlation coefficient (R) of -0.043 and weighted average of 4.7%. Similarly, the statistical analysis conducted on geographies consisting of 373,432,336 people shows no correlation between the proportion of Lebanese and unemployment rate among population between the ages 55 and 59 in the United States with a correlation coefficient (R) of 0.004 and weighted average of 4.6%, a difference of 1.5%.
Asian vs Lebanese Unemployment Among Ages 55 to 59 years

Unemployment Among Ages 55 to 59 years Correlation Summary

MeasurementAsianLebanese
Minimum1.5%1.7%
Maximum8.3%10.3%
Range6.8%8.6%
Mean4.7%4.9%
Median4.6%4.6%
Interquartile 25% (IQ1)4.1%3.9%
Interquartile 75% (IQ3)5.2%5.6%
Interquartile Range (IQR)1.1%1.7%
Standard Deviation (Sample)1.2%2.1%
Standard Deviation (Population)1.2%2.0%

Similar Demographics by Unemployment Among Ages 55 to 59 years

Demographics Similar to Asians by Unemployment Among Ages 55 to 59 years

In terms of unemployment among ages 55 to 59 years, the demographic groups most similar to Asians are South American Indian (4.7%, a difference of 0.010%), Turkish (4.7%, a difference of 0.010%), Immigrants from Chile (4.7%, a difference of 0.020%), White/Caucasian (4.7%, a difference of 0.020%), and Bangladeshi (4.7%, a difference of 0.070%).
DemographicsRating | RankUnemployment Among Ages 55 to 59 years
Egyptians
92.9
/100
|
#110
Exceptional
4.7%
Austrians
92.4
/100
|
#111
Exceptional
4.7%
Afghans
92.1
/100
|
#112
Exceptional
4.7%
Immigrants | Spain
91.4
/100
|
#113
Exceptional
4.7%
Bangladeshis
91.3
/100
|
#114
Exceptional
4.7%
South American Indians
90.9
/100
|
#115
Exceptional
4.7%
Turks
90.9
/100
|
#116
Exceptional
4.7%
Asians
90.8
/100
|
#117
Exceptional
4.7%
Immigrants | Chile
90.7
/100
|
#118
Exceptional
4.7%
Whites/Caucasians
90.7
/100
|
#119
Exceptional
4.7%
Immigrants | South Africa
89.9
/100
|
#120
Excellent
4.7%
Pakistanis
89.7
/100
|
#121
Excellent
4.7%
Immigrants | Afghanistan
89.5
/100
|
#122
Excellent
4.7%
Immigrants | Japan
89.4
/100
|
#123
Excellent
4.7%
Lithuanians
88.8
/100
|
#124
Excellent
4.7%

Demographics Similar to Lebanese by Unemployment Among Ages 55 to 59 years

In terms of unemployment among ages 55 to 59 years, the demographic groups most similar to Lebanese are Latvian (4.6%, a difference of 0.12%), Taiwanese (4.6%, a difference of 0.17%), Cambodian (4.6%, a difference of 0.24%), Malaysian (4.7%, a difference of 0.24%), and Immigrants from Vietnam (4.7%, a difference of 0.24%).
DemographicsRating | RankUnemployment Among Ages 55 to 59 years
Immigrants | Bosnia and Herzegovina
98.3
/100
|
#76
Exceptional
4.6%
Scotch-Irish
98.3
/100
|
#77
Exceptional
4.6%
Finns
98.2
/100
|
#78
Exceptional
4.6%
Sri Lankans
98.1
/100
|
#79
Exceptional
4.6%
Cambodians
98.0
/100
|
#80
Exceptional
4.6%
Taiwanese
97.9
/100
|
#81
Exceptional
4.6%
Latvians
97.8
/100
|
#82
Exceptional
4.6%
Lebanese
97.5
/100
|
#83
Exceptional
4.6%
Malaysians
96.9
/100
|
#84
Exceptional
4.7%
Immigrants | Vietnam
96.9
/100
|
#85
Exceptional
4.7%
Immigrants | Colombia
96.9
/100
|
#86
Exceptional
4.7%
Poles
96.9
/100
|
#87
Exceptional
4.7%
Immigrants | Cameroon
96.9
/100
|
#88
Exceptional
4.7%
Irish
96.8
/100
|
#89
Exceptional
4.7%
Immigrants | Poland
96.4
/100
|
#90
Exceptional
4.7%