Asian vs Immigrants from India Unemployment Among Ages 25 to 29 years

COMPARE

Asian
Race
Ancestry
AfghanAfricanAlaska NativeAlaskan AthabascanAlbanianAleutAlsatianAmericanApacheArabArapahoArgentineanArmenianAssyrian/Chaldean/SyriacAustralianAustrianBahamianBangladeshiBarbadianBasqueBelgianBelizeanBermudanBhutaneseBlackfeetBolivianBrazilianBritishBritish West IndianBulgarianBurmeseCajunCambodianCanadianCape VerdeanCarpatho RusynCelticCentral AmericanCentral American IndianCherokeeCheyenneChickasawChileanChineseChippewaChoctawColombianColvilleComancheCosta RicanCreeCreekCroatianCrowCubanCypriotCzechCzechoslovakianDanishDelawareDominicanDutchDutch West IndianEastern EuropeanEcuadorianEgyptianEnglishEstonianEthiopianEuropeanFijianFilipinoFinnishFrenchFrench American IndianFrench CanadianGermanGerman RussianGhanaianGreekGuamanian/ChamorroGuatemalanGuyaneseHaitianHmongHonduranHopiHoumaHungarianIcelanderIndian (Asian)IndonesianInupiatIranianIraqiIrishIroquoisIsraeliItalianJamaicanJapaneseJordanianKenyanKiowaKoreanLaotianLatvianLebaneseLiberianLithuanianLumbeeLuxembourgerMacedonianMalaysianMalteseMarshalleseMenomineeMexicanMexican American IndianMongolianMoroccanNative HawaiianNavajoNepaleseNew ZealanderNicaraguanNigerianNorthern EuropeanNorwegianOkinawanOsageOttawaPaiutePakistaniPalestinianPanamanianParaguayanPennsylvania GermanPeruvianPimaPolishPortuguesePotawatomiPuebloPuerto RicanPuget Sound SalishRomanianRussianSalvadoranSamoanScandinavianScotch-IrishScottishSeminoleSenegaleseSerbianShoshoneSierra LeoneanSiouxSlavicSlovakSloveneSomaliSouth AfricanSouth AmericanSouth American IndianSoviet UnionSpaniardSpanishSpanish AmericanSpanish American IndianSri LankanSubsaharan AfricanSudaneseSwedishSwissSyrianTaiwaneseThaiTlingit-HaidaTohono O'OdhamTonganTrinidadian and TobagonianTsimshianTurkishU.S. Virgin IslanderUgandanUkrainianUruguayanUteVenezuelanVietnameseWelshWest IndianYakamaYaquiYugoslavianYumanYup'ikZimbabwean
Immigration
NonimmigrantsImmigrantsAfghanistanAfricaAlbaniaArgentinaArmeniaAsiaAustraliaAustriaBahamasBangladeshBarbadosBelarusBelgiumBelizeBoliviaBosnia and HerzegovinaBrazilBulgariaBurma/MyanmarCabo VerdeCambodiaCameroonCanadaCaribbeanCentral AmericaChileChinaColombiaCongoCosta RicaCroatiaCubaCzechoslovakiaDenmarkDominicaDominican RepublicEastern AfricaEastern AsiaEastern EuropeEcuadorEgyptEl SalvadorEnglandEritreaEthiopiaEuropeFijiFranceGermanyGhanaGreeceGrenadaGuatemalaGuyanaHaitiHondurasHong KongHungaryIndonesiaIranIraqIrelandIsraelItalyJamaicaJapanJordanKazakhstanKenyaKoreaKuwaitLaosLatin AmericaLatviaLebanonLiberiaLithuaniaMalaysiaMexicoMicronesiaMiddle AfricaMoldovaMoroccoNepalNetherlandsNicaraguaNigeriaNorth AmericaNorth MacedoniaNorthern AfricaNorthern EuropeNorwayOceaniaPakistanPanamaPeruPhilippinesPolandPortugalRomaniaRussiaSaudi ArabiaScotlandSenegalSerbiaSierra LeoneSingaporeSomaliaSouth AfricaSouth AmericaSouth Central AsiaSouth Eastern AsiaSouthern EuropeSpainSri LankaSt. Vincent and the GrenadinesSudanSwedenSwitzerlandSyriaTaiwanThailandTrinidad and TobagoTurkeyUgandaUkraineUruguayUzbekistanVenezuelaVietnamWest IndiesWestern AfricaWestern AsiaWestern EuropeYemenZaireZimbabweAzores
Immigrants from India
Race
Ancestry
AfghanAfricanAlaska NativeAlaskan AthabascanAlbanianAleutAlsatianAmericanApacheArabArapahoArgentineanArmenianAssyrian/Chaldean/SyriacAustralianAustrianBahamianBangladeshiBarbadianBasqueBelgianBelizeanBermudanBhutaneseBlackfeetBolivianBrazilianBritishBritish West IndianBulgarianBurmeseCajunCambodianCanadianCape VerdeanCarpatho RusynCelticCentral AmericanCentral American IndianCherokeeCheyenneChickasawChileanChineseChippewaChoctawColombianColvilleComancheCosta RicanCreeCreekCroatianCrowCubanCypriotCzechCzechoslovakianDanishDelawareDominicanDutchDutch West IndianEastern EuropeanEcuadorianEgyptianEnglishEstonianEthiopianEuropeanFijianFilipinoFinnishFrenchFrench American IndianFrench CanadianGermanGerman RussianGhanaianGreekGuamanian/ChamorroGuatemalanGuyaneseHaitianHmongHonduranHopiHoumaHungarianIcelanderIndian (Asian)IndonesianInupiatIranianIraqiIrishIroquoisIsraeliItalianJamaicanJapaneseJordanianKenyanKiowaKoreanLaotianLatvianLebaneseLiberianLithuanianLumbeeLuxembourgerMacedonianMalaysianMalteseMarshalleseMenomineeMexicanMexican American IndianMongolianMoroccanNative HawaiianNavajoNepaleseNew ZealanderNicaraguanNigerianNorthern EuropeanNorwegianOkinawanOsageOttawaPaiutePakistaniPalestinianPanamanianParaguayanPennsylvania GermanPeruvianPimaPolishPortuguesePotawatomiPuebloPuerto RicanPuget Sound SalishRomanianRussianSalvadoranSamoanScandinavianScotch-IrishScottishSeminoleSenegaleseSerbianShoshoneSierra LeoneanSiouxSlavicSlovakSloveneSomaliSouth AfricanSouth AmericanSouth American IndianSoviet UnionSpaniardSpanishSpanish AmericanSpanish American IndianSri LankanSubsaharan AfricanSudaneseSwedishSwissSyrianTaiwaneseThaiTlingit-HaidaTohono O'OdhamTonganTrinidadian and TobagonianTsimshianTurkishU.S. Virgin IslanderUgandanUkrainianUruguayanUteVenezuelanVietnameseWelshWest IndianYakamaYaquiYugoslavianYumanYup'ikZimbabwean
Immigration
NonimmigrantsImmigrantsAfghanistanAfricaAlbaniaArgentinaArmeniaAsiaAustraliaAustriaBahamasBangladeshBarbadosBelarusBelgiumBelizeBoliviaBosnia and HerzegovinaBrazilBulgariaBurma/MyanmarCabo VerdeCambodiaCameroonCanadaCaribbeanCentral AmericaChileChinaColombiaCongoCosta RicaCroatiaCubaCzechoslovakiaDenmarkDominicaDominican RepublicEastern AfricaEastern AsiaEastern EuropeEcuadorEgyptEl SalvadorEnglandEritreaEthiopiaEuropeFijiFranceGermanyGhanaGreeceGrenadaGuatemalaGuyanaHaitiHondurasHong KongHungaryIndiaIndonesiaIranIraqIrelandIsraelItalyJamaicaJapanJordanKazakhstanKenyaKoreaKuwaitLaosLatin AmericaLatviaLebanonLiberiaLithuaniaMalaysiaMexicoMicronesiaMiddle AfricaMoldovaMoroccoNepalNetherlandsNicaraguaNigeriaNorth AmericaNorth MacedoniaNorthern AfricaNorthern EuropeNorwayOceaniaPakistanPanamaPeruPhilippinesPolandPortugalRomaniaRussiaSaudi ArabiaScotlandSenegalSerbiaSierra LeoneSingaporeSomaliaSouth AfricaSouth AmericaSouth Central AsiaSouth Eastern AsiaSouthern EuropeSpainSri LankaSt. Vincent and the GrenadinesSudanSwedenSwitzerlandSyriaTaiwanThailandTrinidad and TobagoTurkeyUgandaUkraineUruguayUzbekistanVenezuelaVietnamWest IndiesWestern AfricaWestern AsiaWestern EuropeYemenZaireZimbabweAzores
Unemployment Among Ages 25 to 29 years
Income
Poverty
Unemployment
Labor Participation
Family Structure
Vehicle Availability
Education Level
Disability

Unemployment Among Ages 25 to 29 years Comparison

Asians

Immigrants from India

Exceptional
Exceptional
6.3%
UNEMPLOYMENT AMONG AGES 25 TO 29 YEARS
96.4/ 100
METRIC RATING
78th/ 347
METRIC RANK
5.7%
UNEMPLOYMENT AMONG AGES 25 TO 29 YEARS
100.0/ 100
METRIC RATING
7th/ 347
METRIC RANK

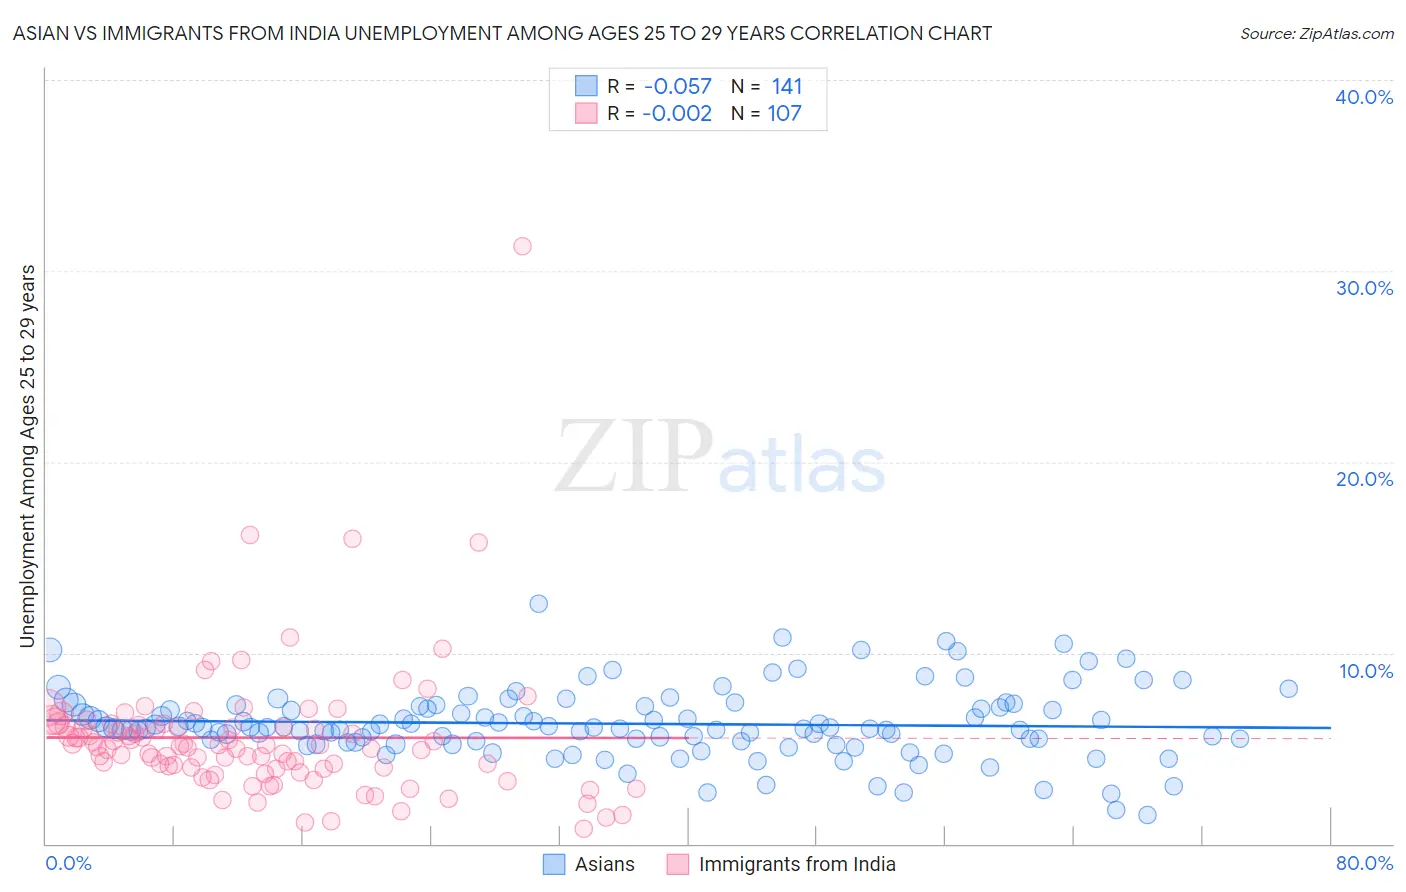
Asian vs Immigrants from India Unemployment Among Ages 25 to 29 years Correlation Chart

The statistical analysis conducted on geographies consisting of 498,860,275 people shows a slight negative correlation between the proportion of Asians and unemployment rate among population between the ages 25 and 29 in the United States with a correlation coefficient (R) of -0.057 and weighted average of 6.3%. Similarly, the statistical analysis conducted on geographies consisting of 410,894,390 people shows no correlation between the proportion of Immigrants from India and unemployment rate among population between the ages 25 and 29 in the United States with a correlation coefficient (R) of -0.002 and weighted average of 5.7%, a difference of 11.4%.
Asian vs Immigrants from India Unemployment Among Ages 25 to 29 years

Unemployment Among Ages 25 to 29 years Correlation Summary

MeasurementAsianImmigrants from India
Minimum1.5%0.80%
Maximum12.6%31.3%
Range11.1%30.5%
Mean6.3%5.6%
Median6.1%5.1%
Interquartile 25% (IQ1)5.4%3.9%
Interquartile 75% (IQ3)7.2%6.2%
Interquartile Range (IQR)1.8%2.3%
Standard Deviation (Sample)1.8%3.6%
Standard Deviation (Population)1.8%3.6%

Similar Demographics by Unemployment Among Ages 25 to 29 years

Demographics Similar to Asians by Unemployment Among Ages 25 to 29 years

In terms of unemployment among ages 25 to 29 years, the demographic groups most similar to Asians are Icelander (6.3%, a difference of 0.10%), Immigrants from Korea (6.3%, a difference of 0.12%), Immigrants from Switzerland (6.3%, a difference of 0.17%), Immigrants from Jordan (6.3%, a difference of 0.18%), and Immigrants from Romania (6.3%, a difference of 0.24%).
DemographicsRating | RankUnemployment Among Ages 25 to 29 years
Immigrants | France
97.4
/100
|
#71
Exceptional
6.3%
Scandinavians
97.4
/100
|
#72
Exceptional
6.3%
Belgians
97.0
/100
|
#73
Exceptional
6.3%
Carpatho Rusyns
96.9
/100
|
#74
Exceptional
6.3%
Immigrants | Jordan
96.8
/100
|
#75
Exceptional
6.3%
Immigrants | Korea
96.7
/100
|
#76
Exceptional
6.3%
Icelanders
96.6
/100
|
#77
Exceptional
6.3%
Asians
96.4
/100
|
#78
Exceptional
6.3%
Immigrants | Switzerland
96.0
/100
|
#79
Exceptional
6.3%
Immigrants | Romania
95.9
/100
|
#80
Exceptional
6.3%
Iranians
95.8
/100
|
#81
Exceptional
6.3%
Immigrants | Poland
95.7
/100
|
#82
Exceptional
6.3%
Slovenes
95.3
/100
|
#83
Exceptional
6.3%
Immigrants | Spain
95.2
/100
|
#84
Exceptional
6.3%
Immigrants | Sweden
95.1
/100
|
#85
Exceptional
6.3%

Demographics Similar to Immigrants from India by Unemployment Among Ages 25 to 29 years

In terms of unemployment among ages 25 to 29 years, the demographic groups most similar to Immigrants from India are Hmong (5.7%, a difference of 0.080%), Immigrants from Bosnia and Herzegovina (5.7%, a difference of 0.12%), Somali (5.6%, a difference of 0.27%), Immigrants from Cuba (5.6%, a difference of 0.34%), and Immigrants from Nepal (5.7%, a difference of 1.4%).
DemographicsRating | RankUnemployment Among Ages 25 to 29 years
Sudanese
100.0
/100
|
#1
Exceptional
5.4%
Tongans
100.0
/100
|
#2
Exceptional
5.5%
Immigrants | Somalia
100.0
/100
|
#3
Exceptional
5.5%
Immigrants | Cuba
100.0
/100
|
#4
Exceptional
5.6%
Somalis
100.0
/100
|
#5
Exceptional
5.6%
Hmong
100.0
/100
|
#6
Exceptional
5.7%
Immigrants | India
100.0
/100
|
#7
Exceptional
5.7%
Immigrants | Bosnia and Herzegovina
100.0
/100
|
#8
Exceptional
5.7%
Immigrants | Nepal
100.0
/100
|
#9
Exceptional
5.7%
Immigrants | Sudan
100.0
/100
|
#10
Exceptional
5.8%
Cambodians
100.0
/100
|
#11
Exceptional
5.8%
Okinawans
100.0
/100
|
#12
Exceptional
5.9%
Immigrants | Bolivia
100.0
/100
|
#13
Exceptional
5.9%
Immigrants | Kuwait
99.9
/100
|
#14
Exceptional
5.9%
Cubans
99.9
/100
|
#15
Exceptional
5.9%