Argentinean vs Immigrants from Haiti Unemployment
COMPARE
Argentinean
Immigrants from Haiti
Unemployment
Unemployment Comparison
Argentineans
Immigrants from Haiti
5.1%
UNEMPLOYMENT
92.4/ 100
METRIC RATING
113th/ 347
METRIC RANK
6.3%
UNEMPLOYMENT
0.0/ 100
METRIC RATING
298th/ 347
METRIC RANK
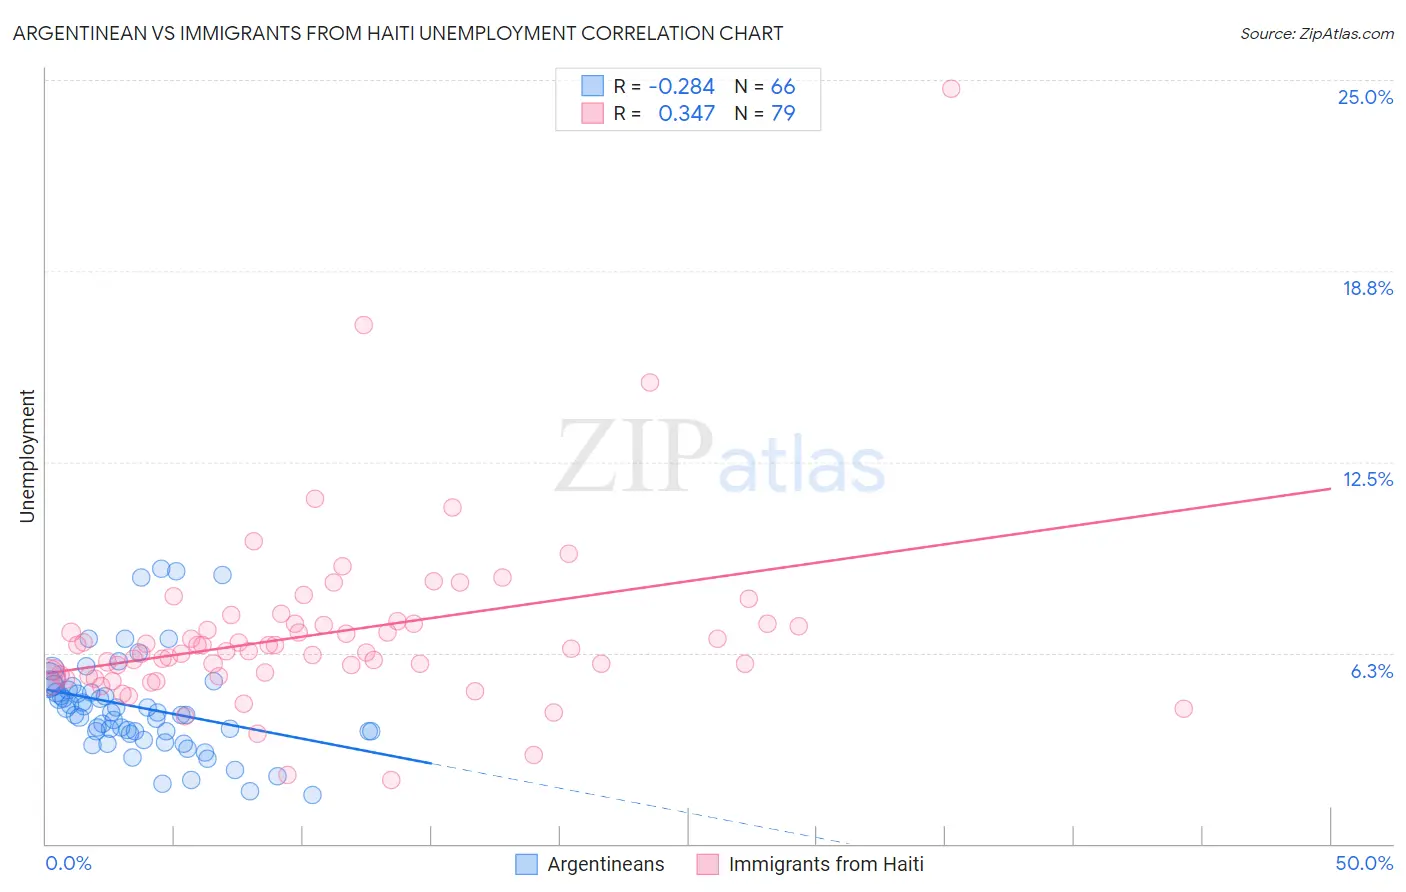
Argentinean vs Immigrants from Haiti Unemployment Correlation Chart
The statistical analysis conducted on geographies consisting of 297,046,481 people shows a weak negative correlation between the proportion of Argentineans and unemployment in the United States with a correlation coefficient (R) of -0.284 and weighted average of 5.1%. Similarly, the statistical analysis conducted on geographies consisting of 225,163,830 people shows a mild positive correlation between the proportion of Immigrants from Haiti and unemployment in the United States with a correlation coefficient (R) of 0.347 and weighted average of 6.3%, a difference of 24.7%.
Unemployment Correlation Summary
| Measurement | Argentinean | Immigrants from Haiti |
| Minimum | 1.6% | 2.1% |
| Maximum | 9.0% | 24.7% |
| Range | 7.4% | 22.6% |
| Mean | 4.5% | 6.9% |
| Median | 4.3% | 6.3% |
| Interquartile 25% (IQ1) | 3.7% | 5.5% |
| Interquartile 75% (IQ3) | 5.0% | 7.2% |
| Interquartile Range (IQR) | 1.4% | 1.7% |
| Standard Deviation (Sample) | 1.6% | 3.0% |
| Standard Deviation (Population) | 1.6% | 3.0% |
Similar Demographics by Unemployment
Demographics Similar to Argentineans by Unemployment
In terms of unemployment, the demographic groups most similar to Argentineans are South African (5.1%, a difference of 0.040%), Immigrants from Ireland (5.1%, a difference of 0.060%), Immigrants from Lithuania (5.0%, a difference of 0.19%), Chilean (5.0%, a difference of 0.19%), and Immigrants from Eritrea (5.0%, a difference of 0.21%).
| Demographics | Rating | Rank | Unemployment |
| Immigrants | Romania | 93.7 /100 | #106 | Exceptional 5.0% |
| Immigrants | Turkey | 93.7 /100 | #107 | Exceptional 5.0% |
| Immigrants | Kuwait | 93.7 /100 | #108 | Exceptional 5.0% |
| Immigrants | Eritrea | 93.3 /100 | #109 | Exceptional 5.0% |
| Immigrants | Lithuania | 93.2 /100 | #110 | Exceptional 5.0% |
| Chileans | 93.2 /100 | #111 | Exceptional 5.0% |
| South Africans | 92.6 /100 | #112 | Exceptional 5.1% |
| Argentineans | 92.4 /100 | #113 | Exceptional 5.1% |
| Immigrants | Ireland | 92.1 /100 | #114 | Exceptional 5.1% |
| Immigrants | Western Europe | 91.1 /100 | #115 | Exceptional 5.1% |
| Immigrants | Sri Lanka | 91.1 /100 | #116 | Exceptional 5.1% |
| Immigrants | Malaysia | 91.0 /100 | #117 | Exceptional 5.1% |
| Immigrants | Germany | 90.8 /100 | #118 | Exceptional 5.1% |
| Immigrants | France | 89.7 /100 | #119 | Excellent 5.1% |
| Macedonians | 89.7 /100 | #120 | Excellent 5.1% |
Demographics Similar to Immigrants from Haiti by Unemployment
In terms of unemployment, the demographic groups most similar to Immigrants from Haiti are Immigrants from West Indies (6.3%, a difference of 0.050%), Jamaican (6.3%, a difference of 0.090%), Immigrants from Trinidad and Tobago (6.3%, a difference of 0.17%), Ute (6.3%, a difference of 0.43%), and Trinidadian and Tobagonian (6.3%, a difference of 0.65%).
| Demographics | Rating | Rank | Unemployment |
| Haitians | 0.0 /100 | #291 | Tragic 6.2% |
| Central American Indians | 0.0 /100 | #292 | Tragic 6.2% |
| Immigrants | Ecuador | 0.0 /100 | #293 | Tragic 6.2% |
| Spanish American Indians | 0.0 /100 | #294 | Tragic 6.2% |
| U.S. Virgin Islanders | 0.0 /100 | #295 | Tragic 6.3% |
| Ute | 0.0 /100 | #296 | Tragic 6.3% |
| Jamaicans | 0.0 /100 | #297 | Tragic 6.3% |
| Immigrants | Haiti | 0.0 /100 | #298 | Tragic 6.3% |
| Immigrants | West Indies | 0.0 /100 | #299 | Tragic 6.3% |
| Immigrants | Trinidad and Tobago | 0.0 /100 | #300 | Tragic 6.3% |
| Trinidadians and Tobagonians | 0.0 /100 | #301 | Tragic 6.3% |
| West Indians | 0.0 /100 | #302 | Tragic 6.4% |
| Belizeans | 0.0 /100 | #303 | Tragic 6.4% |
| Immigrants | Jamaica | 0.0 /100 | #304 | Tragic 6.4% |
| Menominee | 0.0 /100 | #305 | Tragic 6.4% |