Argentinean vs Immigrants from Bosnia and Herzegovina Unemployment Among Ages 20 to 24 years
COMPARE
Argentinean
Immigrants from Bosnia and Herzegovina
Unemployment Among Ages 20 to 24 years
Unemployment Among Ages 20 to 24 years Comparison
Argentineans
Immigrants from Bosnia and Herzegovina
10.2%
UNEMPLOYMENT AMONG AGES 20 TO 24 YEARS
78.0/ 100
METRIC RATING
145th/ 347
METRIC RANK
9.4%
UNEMPLOYMENT AMONG AGES 20 TO 24 YEARS
100.0/ 100
METRIC RATING
21st/ 347
METRIC RANK
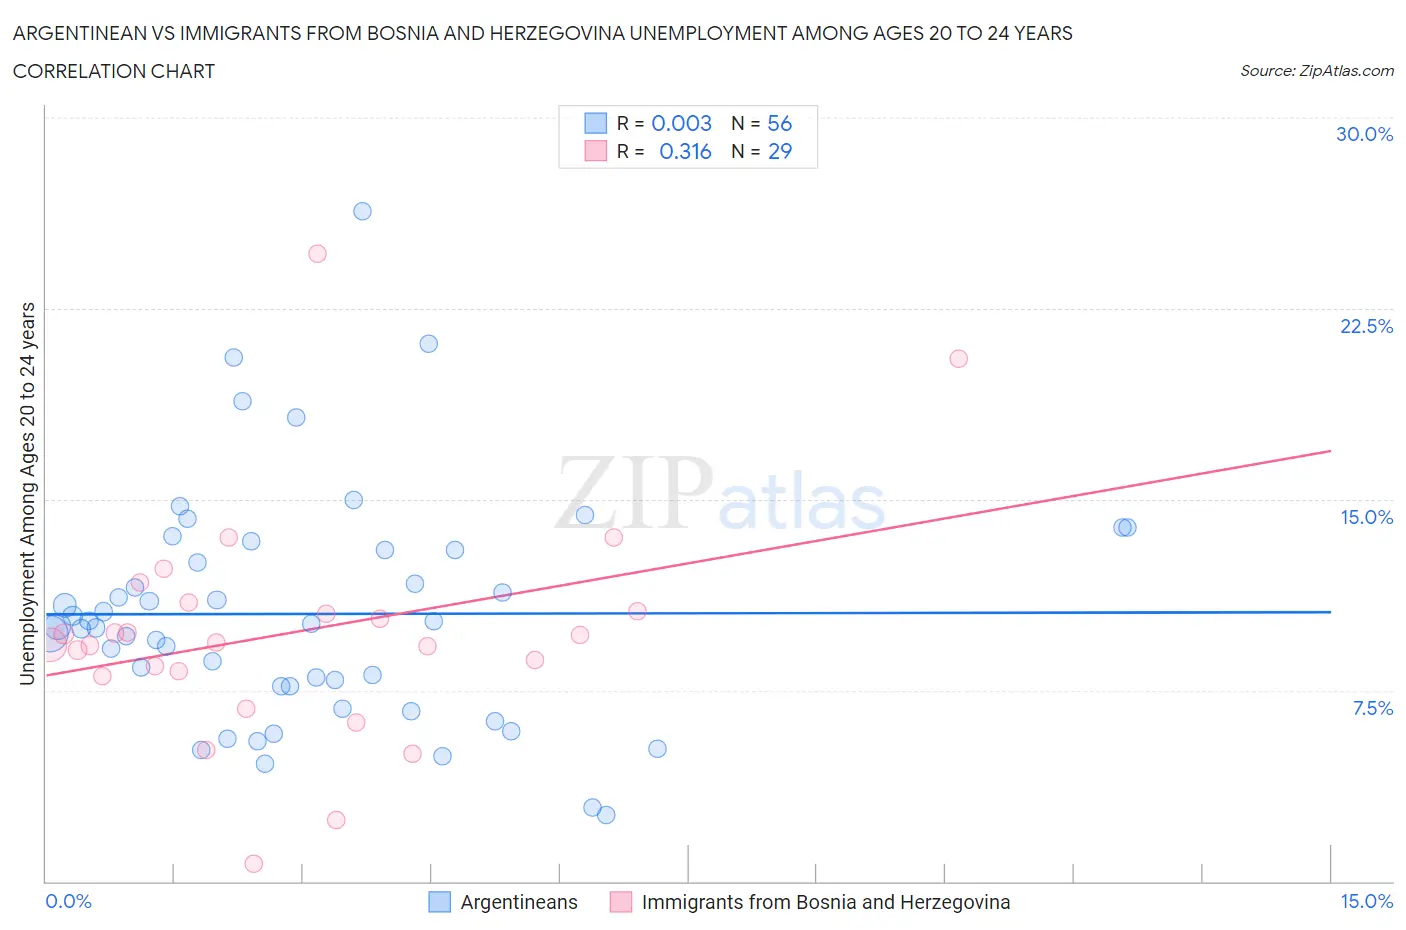
Argentinean vs Immigrants from Bosnia and Herzegovina Unemployment Among Ages 20 to 24 years Correlation Chart
The statistical analysis conducted on geographies consisting of 292,519,448 people shows no correlation between the proportion of Argentineans and unemployment rate among population between the ages 20 and 24 in the United States with a correlation coefficient (R) of 0.003 and weighted average of 10.2%. Similarly, the statistical analysis conducted on geographies consisting of 154,747,093 people shows a mild positive correlation between the proportion of Immigrants from Bosnia and Herzegovina and unemployment rate among population between the ages 20 and 24 in the United States with a correlation coefficient (R) of 0.316 and weighted average of 9.4%, a difference of 8.6%.
Unemployment Among Ages 20 to 24 years Correlation Summary
| Measurement | Argentinean | Immigrants from Bosnia and Herzegovina |
| Minimum | 2.6% | 0.70% |
| Maximum | 26.3% | 24.7% |
| Range | 23.7% | 24.0% |
| Mean | 10.5% | 9.8% |
| Median | 10.1% | 9.4% |
| Interquartile 25% (IQ1) | 7.6% | 8.1% |
| Interquartile 75% (IQ3) | 13.0% | 10.8% |
| Interquartile Range (IQR) | 5.4% | 2.6% |
| Standard Deviation (Sample) | 4.6% | 4.6% |
| Standard Deviation (Population) | 4.5% | 4.5% |
Similar Demographics by Unemployment Among Ages 20 to 24 years
Demographics Similar to Argentineans by Unemployment Among Ages 20 to 24 years
In terms of unemployment among ages 20 to 24 years, the demographic groups most similar to Argentineans are Brazilian (10.2%, a difference of 0.020%), Asian (10.2%, a difference of 0.020%), French Canadian (10.2%, a difference of 0.030%), Immigrants from Jordan (10.2%, a difference of 0.060%), and Immigrants from Romania (10.2%, a difference of 0.12%).
| Demographics | Rating | Rank | Unemployment Among Ages 20 to 24 years |
| Burmese | 82.3 /100 | #138 | Excellent 10.2% |
| Uruguayans | 81.9 /100 | #139 | Excellent 10.2% |
| Immigrants | Austria | 81.4 /100 | #140 | Excellent 10.2% |
| Immigrants | Azores | 81.4 /100 | #141 | Excellent 10.2% |
| Slovaks | 80.2 /100 | #142 | Excellent 10.2% |
| Immigrants | Jordan | 79.0 /100 | #143 | Good 10.2% |
| Brazilians | 78.4 /100 | #144 | Good 10.2% |
| Argentineans | 78.0 /100 | #145 | Good 10.2% |
| Asians | 77.7 /100 | #146 | Good 10.2% |
| French Canadians | 77.5 /100 | #147 | Good 10.2% |
| Immigrants | Romania | 75.7 /100 | #148 | Good 10.2% |
| Immigrants | Scotland | 74.6 /100 | #149 | Good 10.2% |
| Hungarians | 74.4 /100 | #150 | Good 10.2% |
| Immigrants | South Africa | 73.6 /100 | #151 | Good 10.2% |
| Iranians | 72.4 /100 | #152 | Good 10.2% |
Demographics Similar to Immigrants from Bosnia and Herzegovina by Unemployment Among Ages 20 to 24 years
In terms of unemployment among ages 20 to 24 years, the demographic groups most similar to Immigrants from Bosnia and Herzegovina are Hmong (9.4%, a difference of 0.010%), Osage (9.4%, a difference of 0.010%), Chinese (9.4%, a difference of 0.13%), Tongan (9.4%, a difference of 0.27%), and Immigrants from Nepal (9.4%, a difference of 0.27%).
| Demographics | Rating | Rank | Unemployment Among Ages 20 to 24 years |
| Slovenes | 100.0 /100 | #14 | Exceptional 9.3% |
| Immigrants | Sudan | 100.0 /100 | #15 | Exceptional 9.3% |
| Danes | 100.0 /100 | #16 | Exceptional 9.3% |
| Czechs | 100.0 /100 | #17 | Exceptional 9.3% |
| Chinese | 100.0 /100 | #18 | Exceptional 9.4% |
| Hmong | 100.0 /100 | #19 | Exceptional 9.4% |
| Osage | 100.0 /100 | #20 | Exceptional 9.4% |
| Immigrants | Bosnia and Herzegovina | 100.0 /100 | #21 | Exceptional 9.4% |
| Tongans | 100.0 /100 | #22 | Exceptional 9.4% |
| Immigrants | Nepal | 100.0 /100 | #23 | Exceptional 9.4% |
| Taiwanese | 100.0 /100 | #24 | Exceptional 9.4% |
| Immigrants | Eritrea | 100.0 /100 | #25 | Exceptional 9.5% |
| Swedes | 100.0 /100 | #26 | Exceptional 9.5% |
| Immigrants | Zimbabwe | 100.0 /100 | #27 | Exceptional 9.5% |
| Immigrants | Afghanistan | 100.0 /100 | #28 | Exceptional 9.5% |