Arapaho vs Immigrants from Albania Unemployment Among Women with Children Under 6 years
COMPARE
Arapaho
Immigrants from Albania
Unemployment Among Women with Children Under 6 years
Unemployment Among Women with Children Under 6 years Comparison
Arapaho
Immigrants from Albania
19.0%
UNEMPLOYMENT AMONG WOMEN WITH CHILDREN UNDER 6 YEARS
0.0/ 100
METRIC RATING
346th/ 347
METRIC RANK
7.1%
UNEMPLOYMENT AMONG WOMEN WITH CHILDREN UNDER 6 YEARS
98.7/ 100
METRIC RATING
84th/ 347
METRIC RANK
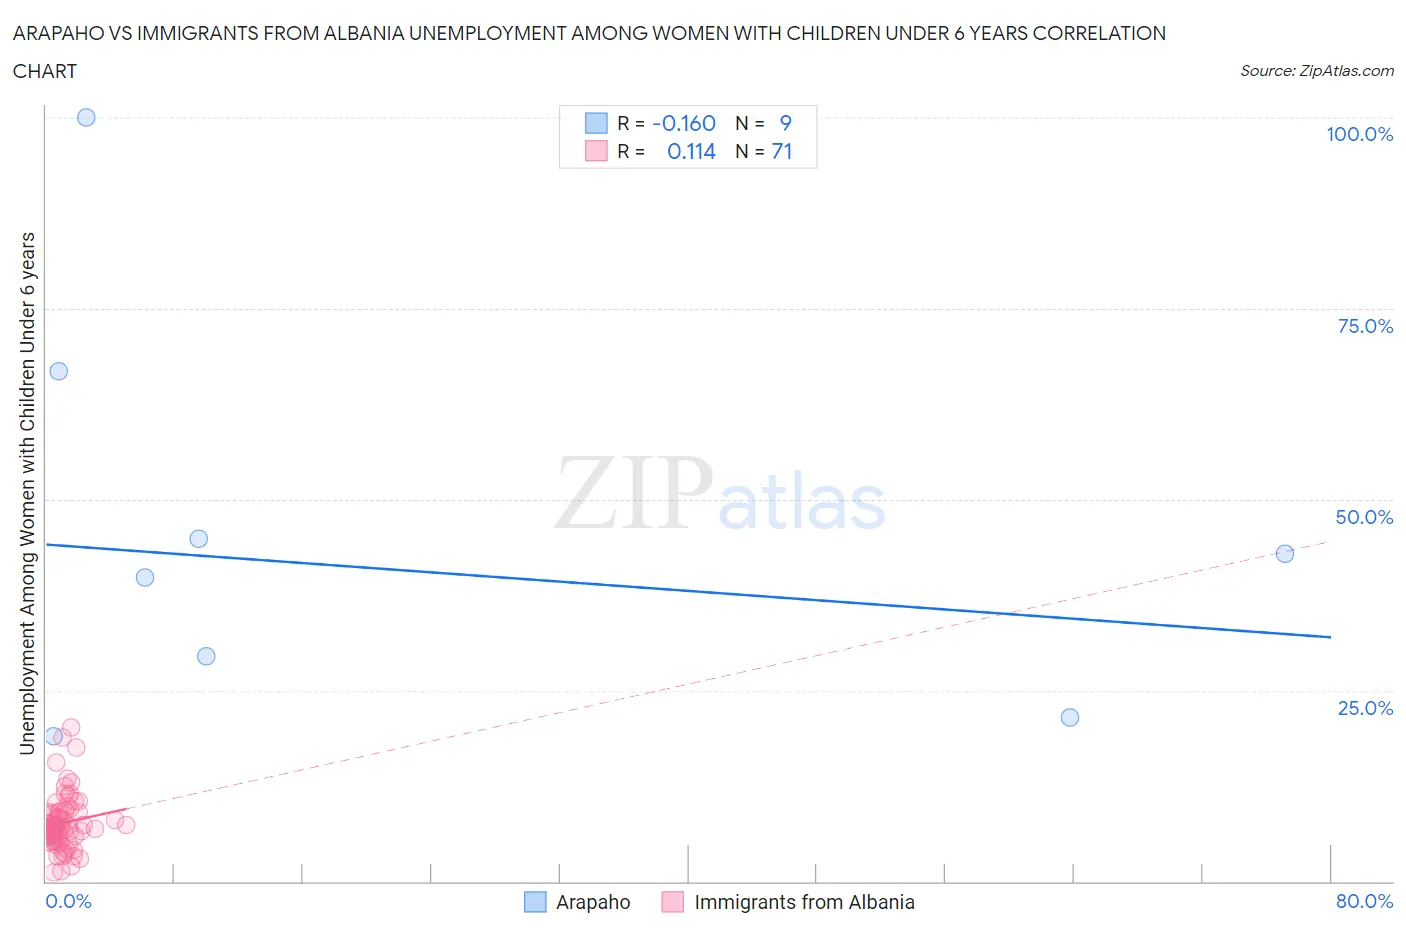
Arapaho vs Immigrants from Albania Unemployment Among Women with Children Under 6 years Correlation Chart
The statistical analysis conducted on geographies consisting of 26,873,708 people shows a poor negative correlation between the proportion of Arapaho and unemployment rate among women with children under the age of 6 in the United States with a correlation coefficient (R) of -0.160 and weighted average of 19.0%. Similarly, the statistical analysis conducted on geographies consisting of 102,982,733 people shows a poor positive correlation between the proportion of Immigrants from Albania and unemployment rate among women with children under the age of 6 in the United States with a correlation coefficient (R) of 0.114 and weighted average of 7.1%, a difference of 168.1%.
Unemployment Among Women with Children Under 6 years Correlation Summary
| Measurement | Arapaho | Immigrants from Albania |
| Minimum | 6.7% | 1.2% |
| Maximum | 100.0% | 20.1% |
| Range | 93.3% | 18.8% |
| Mean | 41.2% | 7.7% |
| Median | 39.8% | 7.1% |
| Interquartile 25% (IQ1) | 20.2% | 5.8% |
| Interquartile 75% (IQ3) | 55.8% | 9.1% |
| Interquartile Range (IQR) | 35.6% | 3.2% |
| Standard Deviation (Sample) | 28.1% | 3.6% |
| Standard Deviation (Population) | 26.5% | 3.6% |
Similar Demographics by Unemployment Among Women with Children Under 6 years
Demographics Similar to Arapaho by Unemployment Among Women with Children Under 6 years
In terms of unemployment among women with children under 6 years, the demographic groups most similar to Arapaho are Inupiat (17.7%, a difference of 7.5%), Yup'ik (21.1%, a difference of 10.6%), Hopi (16.8%, a difference of 13.5%), Crow (14.6%, a difference of 30.0%), and Yuman (14.6%, a difference of 30.1%).
| Demographics | Rating | Rank | Unemployment Among Women with Children Under 6 years |
| Natives/Alaskans | 0.0 /100 | #333 | Tragic 11.5% |
| Apache | 0.0 /100 | #334 | Tragic 12.3% |
| Puerto Ricans | 0.0 /100 | #335 | Tragic 12.5% |
| Shoshone | 0.0 /100 | #336 | Tragic 13.2% |
| Chippewa | 0.0 /100 | #337 | Tragic 13.3% |
| Pima | 0.0 /100 | #338 | Tragic 13.4% |
| Navajo | 0.0 /100 | #339 | Tragic 13.5% |
| Immigrants | Yemen | 0.0 /100 | #340 | Tragic 13.5% |
| Lumbee | 0.0 /100 | #341 | Tragic 13.8% |
| Yuman | 0.0 /100 | #342 | Tragic 14.6% |
| Crow | 0.0 /100 | #343 | Tragic 14.6% |
| Hopi | 0.0 /100 | #344 | Tragic 16.8% |
| Inupiat | 0.0 /100 | #345 | Tragic 17.7% |
| Arapaho | 0.0 /100 | #346 | Tragic 19.0% |
| Yup'ik | 0.0 /100 | #347 | Tragic 21.1% |
Demographics Similar to Immigrants from Albania by Unemployment Among Women with Children Under 6 years
In terms of unemployment among women with children under 6 years, the demographic groups most similar to Immigrants from Albania are Immigrants from Romania (7.1%, a difference of 0.040%), Egyptian (7.1%, a difference of 0.050%), Immigrants from Afghanistan (7.1%, a difference of 0.080%), Immigrants from Zimbabwe (7.1%, a difference of 0.16%), and Immigrants from Venezuela (7.1%, a difference of 0.23%).
| Demographics | Rating | Rank | Unemployment Among Women with Children Under 6 years |
| Immigrants | Croatia | 98.9 /100 | #77 | Exceptional 7.1% |
| Immigrants | Somalia | 98.9 /100 | #78 | Exceptional 7.1% |
| Immigrants | Fiji | 98.9 /100 | #79 | Exceptional 7.1% |
| Immigrants | Greece | 98.9 /100 | #80 | Exceptional 7.1% |
| Immigrants | Venezuela | 98.8 /100 | #81 | Exceptional 7.1% |
| Immigrants | Afghanistan | 98.7 /100 | #82 | Exceptional 7.1% |
| Egyptians | 98.7 /100 | #83 | Exceptional 7.1% |
| Immigrants | Albania | 98.7 /100 | #84 | Exceptional 7.1% |
| Immigrants | Romania | 98.7 /100 | #85 | Exceptional 7.1% |
| Immigrants | Zimbabwe | 98.6 /100 | #86 | Exceptional 7.1% |
| Alsatians | 98.4 /100 | #87 | Exceptional 7.1% |
| Immigrants | Hungary | 98.3 /100 | #88 | Exceptional 7.1% |
| Immigrants | Denmark | 98.3 /100 | #89 | Exceptional 7.1% |
| Immigrants | Spain | 98.2 /100 | #90 | Exceptional 7.1% |
| Danes | 98.2 /100 | #91 | Exceptional 7.1% |