Arab vs Apache Unemployment Among Ages 16 to 19 years

COMPARE

Arab
Race
Ancestry
AfghanAfricanAlaska NativeAlaskan AthabascanAlbanianAleutAlsatianAmericanArabArapahoArgentineanArmenianAssyrian/Chaldean/SyriacAustralianAustrianBahamianBangladeshiBarbadianBasqueBelgianBelizeanBermudanBhutaneseBlackfeetBolivianBrazilianBritishBritish West IndianBulgarianBurmeseCajunCambodianCanadianCape VerdeanCarpatho RusynCelticCentral AmericanCentral American IndianCherokeeCheyenneChickasawChileanChineseChippewaChoctawColombianColvilleComancheCosta RicanCreeCreekCroatianCrowCubanCypriotCzechCzechoslovakianDanishDelawareDominicanDutchDutch West IndianEastern EuropeanEcuadorianEgyptianEnglishEstonianEthiopianEuropeanFijianFilipinoFinnishFrenchFrench American IndianFrench CanadianGermanGerman RussianGhanaianGreekGuamanian/ChamorroGuatemalanGuyaneseHaitianHmongHonduranHopiHoumaHungarianIcelanderIndian (Asian)IndonesianInupiatIranianIraqiIrishIroquoisIsraeliItalianJamaicanJapaneseJordanianKenyanKiowaKoreanLaotianLatvianLebaneseLiberianLithuanianLumbeeLuxembourgerMacedonianMalaysianMalteseMarshalleseMenomineeMexicanMexican American IndianMongolianMoroccanNative HawaiianNavajoNepaleseNew ZealanderNicaraguanNigerianNorthern EuropeanNorwegianOkinawanOsageOttawaPaiutePakistaniPalestinianPanamanianParaguayanPennsylvania GermanPeruvianPimaPolishPortuguesePotawatomiPuebloPuerto RicanPuget Sound SalishRomanianRussianSalvadoranSamoanScandinavianScotch-IrishScottishSeminoleSenegaleseSerbianShoshoneSierra LeoneanSiouxSlavicSlovakSloveneSomaliSouth AfricanSouth AmericanSouth American IndianSoviet UnionSpaniardSpanishSpanish AmericanSpanish American IndianSri LankanSubsaharan AfricanSudaneseSwedishSwissSyrianTaiwaneseThaiTlingit-HaidaTohono O'OdhamTonganTrinidadian and TobagonianTsimshianTurkishU.S. Virgin IslanderUgandanUkrainianUruguayanUteVenezuelanVietnameseWelshWest IndianYakamaYaquiYugoslavianYumanYup'ikZimbabwean
Immigration
NonimmigrantsImmigrantsAfghanistanAfricaAlbaniaArgentinaArmeniaAsiaAustraliaAustriaBahamasBangladeshBarbadosBelarusBelgiumBelizeBoliviaBosnia and HerzegovinaBrazilBulgariaBurma/MyanmarCabo VerdeCambodiaCameroonCanadaCaribbeanCentral AmericaChileChinaColombiaCongoCosta RicaCroatiaCubaCzechoslovakiaDenmarkDominicaDominican RepublicEastern AfricaEastern AsiaEastern EuropeEcuadorEgyptEl SalvadorEnglandEritreaEthiopiaEuropeFijiFranceGermanyGhanaGreeceGrenadaGuatemalaGuyanaHaitiHondurasHong KongHungaryIndiaIndonesiaIranIraqIrelandIsraelItalyJamaicaJapanJordanKazakhstanKenyaKoreaKuwaitLaosLatin AmericaLatviaLebanonLiberiaLithuaniaMalaysiaMexicoMicronesiaMiddle AfricaMoldovaMoroccoNepalNetherlandsNicaraguaNigeriaNorth AmericaNorth MacedoniaNorthern AfricaNorthern EuropeNorwayOceaniaPakistanPanamaPeruPhilippinesPolandPortugalRomaniaRussiaSaudi ArabiaScotlandSenegalSerbiaSierra LeoneSingaporeSomaliaSouth AfricaSouth AmericaSouth Central AsiaSouth Eastern AsiaSouthern EuropeSpainSri LankaSt. Vincent and the GrenadinesSudanSwedenSwitzerlandSyriaTaiwanThailandTrinidad and TobagoTurkeyUgandaUkraineUruguayUzbekistanVenezuelaVietnamWest IndiesWestern AfricaWestern AsiaWestern EuropeYemenZaireZimbabweAzores
Apache
Race
Ancestry
AfghanAfricanAlaska NativeAlaskan AthabascanAlbanianAleutAlsatianAmericanApacheArapahoArgentineanArmenianAssyrian/Chaldean/SyriacAustralianAustrianBahamianBangladeshiBarbadianBasqueBelgianBelizeanBermudanBhutaneseBlackfeetBolivianBrazilianBritishBritish West IndianBulgarianBurmeseCajunCambodianCanadianCape VerdeanCarpatho RusynCelticCentral AmericanCentral American IndianCherokeeCheyenneChickasawChileanChineseChippewaChoctawColombianColvilleComancheCosta RicanCreeCreekCroatianCrowCubanCypriotCzechCzechoslovakianDanishDelawareDominicanDutchDutch West IndianEastern EuropeanEcuadorianEgyptianEnglishEstonianEthiopianEuropeanFijianFilipinoFinnishFrenchFrench American IndianFrench CanadianGermanGerman RussianGhanaianGreekGuamanian/ChamorroGuatemalanGuyaneseHaitianHmongHonduranHopiHoumaHungarianIcelanderIndian (Asian)IndonesianInupiatIranianIraqiIrishIroquoisIsraeliItalianJamaicanJapaneseJordanianKenyanKiowaKoreanLaotianLatvianLebaneseLiberianLithuanianLumbeeLuxembourgerMacedonianMalaysianMalteseMarshalleseMenomineeMexicanMexican American IndianMongolianMoroccanNative HawaiianNavajoNepaleseNew ZealanderNicaraguanNigerianNorthern EuropeanNorwegianOkinawanOsageOttawaPaiutePakistaniPalestinianPanamanianParaguayanPennsylvania GermanPeruvianPimaPolishPortuguesePotawatomiPuebloPuerto RicanPuget Sound SalishRomanianRussianSalvadoranSamoanScandinavianScotch-IrishScottishSeminoleSenegaleseSerbianShoshoneSierra LeoneanSiouxSlavicSlovakSloveneSomaliSouth AfricanSouth AmericanSouth American IndianSoviet UnionSpaniardSpanishSpanish AmericanSpanish American IndianSri LankanSubsaharan AfricanSudaneseSwedishSwissSyrianTaiwaneseThaiTlingit-HaidaTohono O'OdhamTonganTrinidadian and TobagonianTsimshianTurkishU.S. Virgin IslanderUgandanUkrainianUruguayanUteVenezuelanVietnameseWelshWest IndianYakamaYaquiYugoslavianYumanYup'ikZimbabwean
Immigration
NonimmigrantsImmigrantsAfghanistanAfricaAlbaniaArgentinaArmeniaAsiaAustraliaAustriaBahamasBangladeshBarbadosBelarusBelgiumBelizeBoliviaBosnia and HerzegovinaBrazilBulgariaBurma/MyanmarCabo VerdeCambodiaCameroonCanadaCaribbeanCentral AmericaChileChinaColombiaCongoCosta RicaCroatiaCubaCzechoslovakiaDenmarkDominicaDominican RepublicEastern AfricaEastern AsiaEastern EuropeEcuadorEgyptEl SalvadorEnglandEritreaEthiopiaEuropeFijiFranceGermanyGhanaGreeceGrenadaGuatemalaGuyanaHaitiHondurasHong KongHungaryIndiaIndonesiaIranIraqIrelandIsraelItalyJamaicaJapanJordanKazakhstanKenyaKoreaKuwaitLaosLatin AmericaLatviaLebanonLiberiaLithuaniaMalaysiaMexicoMicronesiaMiddle AfricaMoldovaMoroccoNepalNetherlandsNicaraguaNigeriaNorth AmericaNorth MacedoniaNorthern AfricaNorthern EuropeNorwayOceaniaPakistanPanamaPeruPhilippinesPolandPortugalRomaniaRussiaSaudi ArabiaScotlandSenegalSerbiaSierra LeoneSingaporeSomaliaSouth AfricaSouth AmericaSouth Central AsiaSouth Eastern AsiaSouthern EuropeSpainSri LankaSt. Vincent and the GrenadinesSudanSwedenSwitzerlandSyriaTaiwanThailandTrinidad and TobagoTurkeyUgandaUkraineUruguayUzbekistanVenezuelaVietnamWest IndiesWestern AfricaWestern AsiaWestern EuropeYemenZaireZimbabweAzores
Unemployment Among Ages 16 to 19 years
Income
Poverty
Unemployment
Labor Participation
Family Structure
Vehicle Availability
Education Level
Disability

Unemployment Among Ages 16 to 19 years Comparison

Arabs

Apache

Excellent
Tragic
17.2%
UNEMPLOYMENT AMONG AGES 16 TO 19 YEARS
83.9/ 100
METRIC RATING
132nd/ 347
METRIC RANK
18.8%
UNEMPLOYMENT AMONG AGES 16 TO 19 YEARS
0.3/ 100
METRIC RATING
254th/ 347
METRIC RANK

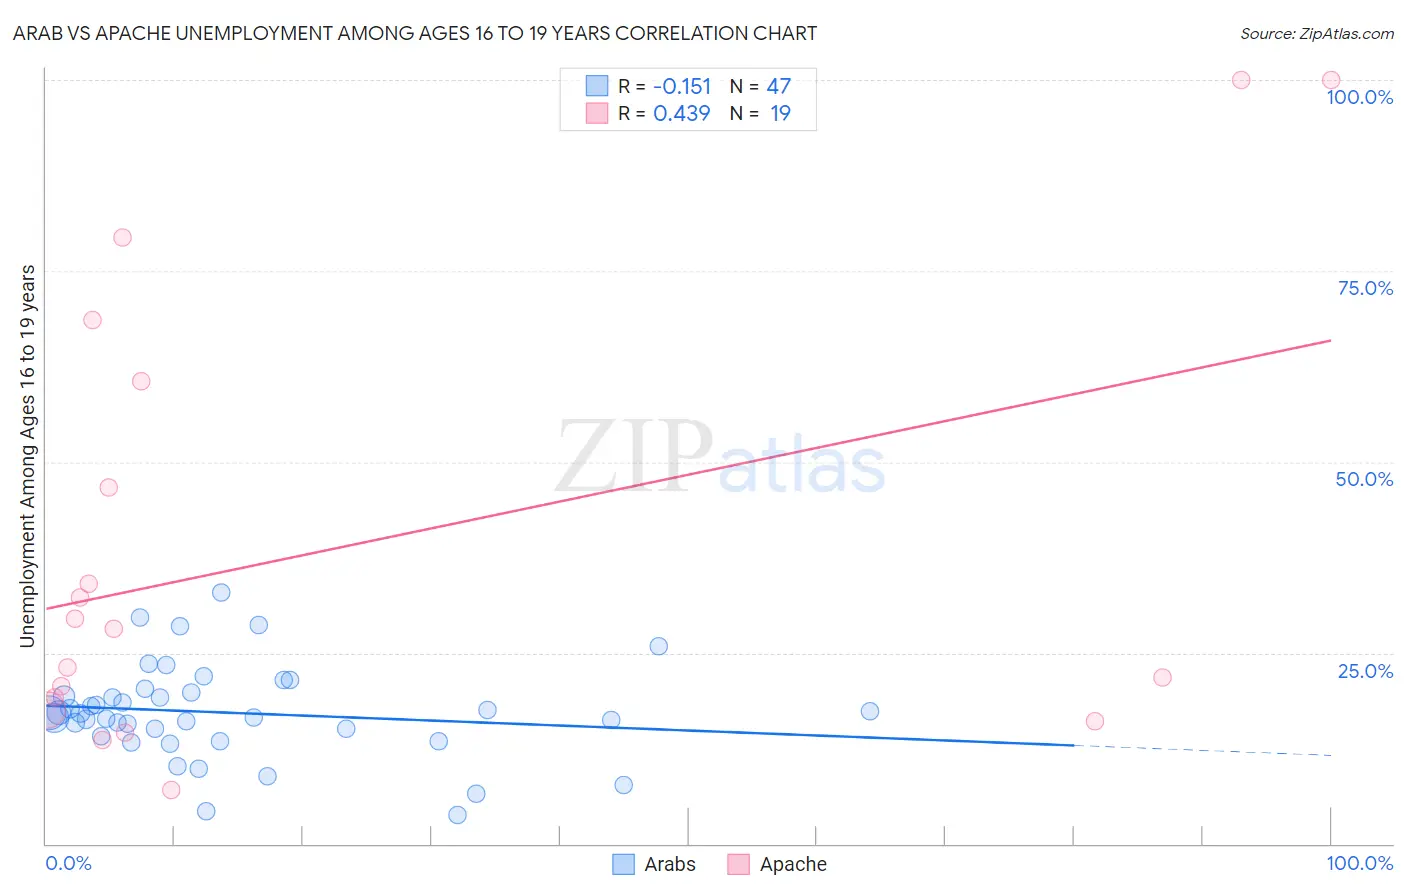
Arab vs Apache Unemployment Among Ages 16 to 19 years Correlation Chart

The statistical analysis conducted on geographies consisting of 454,462,902 people shows a poor negative correlation between the proportion of Arabs and unemployment rate among population between the ages 16 and 19 in the United States with a correlation coefficient (R) of -0.151 and weighted average of 17.2%. Similarly, the statistical analysis conducted on geographies consisting of 223,374,424 people shows a moderate positive correlation between the proportion of Apache and unemployment rate among population between the ages 16 and 19 in the United States with a correlation coefficient (R) of 0.439 and weighted average of 18.8%, a difference of 9.1%.
Arab vs Apache Unemployment Among Ages 16 to 19 years

Unemployment Among Ages 16 to 19 years Correlation Summary

MeasurementArabApache
Minimum3.7%7.1%
Maximum33.0%100.0%
Range29.3%92.9%
Mean17.2%38.5%
Median17.1%28.1%
Interquartile 25% (IQ1)14.1%17.5%
Interquartile 75% (IQ3)19.7%60.6%
Interquartile Range (IQR)5.7%43.2%
Standard Deviation (Sample)6.1%29.1%
Standard Deviation (Population)6.1%28.4%

Similar Demographics by Unemployment Among Ages 16 to 19 years

Demographics Similar to Arabs by Unemployment Among Ages 16 to 19 years

In terms of unemployment among ages 16 to 19 years, the demographic groups most similar to Arabs are Laotian (17.2%, a difference of 0.010%), Potawatomi (17.2%, a difference of 0.010%), German Russian (17.2%, a difference of 0.020%), Samoan (17.2%, a difference of 0.020%), and Immigrants from Indonesia (17.2%, a difference of 0.070%).
DemographicsRating | RankUnemployment Among Ages 16 to 19 years
Immigrants | Germany
87.7
/100
|
#125
Excellent
17.2%
Immigrants | Bolivia
86.7
/100
|
#126
Excellent
17.2%
Pakistanis
85.8
/100
|
#127
Excellent
17.2%
Australians
85.6
/100
|
#128
Excellent
17.2%
Creek
85.5
/100
|
#129
Excellent
17.2%
Immigrants | Indonesia
84.7
/100
|
#130
Excellent
17.2%
German Russians
84.1
/100
|
#131
Excellent
17.2%
Arabs
83.9
/100
|
#132
Excellent
17.2%
Laotians
83.9
/100
|
#133
Excellent
17.2%
Potawatomi
83.8
/100
|
#134
Excellent
17.2%
Samoans
83.7
/100
|
#135
Excellent
17.2%
Immigrants | Oceania
83.1
/100
|
#136
Excellent
17.2%
Immigrants | Malaysia
82.8
/100
|
#137
Excellent
17.2%
Bolivians
81.9
/100
|
#138
Excellent
17.3%
Immigrants | Eritrea
81.1
/100
|
#139
Excellent
17.3%

Demographics Similar to Apache by Unemployment Among Ages 16 to 19 years

In terms of unemployment among ages 16 to 19 years, the demographic groups most similar to Apache are Immigrants from Cameroon (18.8%, a difference of 0.010%), Central American (18.8%, a difference of 0.030%), Mexican American Indian (18.8%, a difference of 0.080%), Immigrants from Guatemala (18.7%, a difference of 0.34%), and Immigrants from Nigeria (18.9%, a difference of 0.34%).
DemographicsRating | RankUnemployment Among Ages 16 to 19 years
Immigrants | Israel
0.5
/100
|
#247
Tragic
18.7%
Delaware
0.5
/100
|
#248
Tragic
18.7%
Puget Sound Salish
0.5
/100
|
#249
Tragic
18.7%
Panamanians
0.4
/100
|
#250
Tragic
18.7%
Sub-Saharan Africans
0.4
/100
|
#251
Tragic
18.7%
Immigrants | Guatemala
0.4
/100
|
#252
Tragic
18.7%
Central Americans
0.3
/100
|
#253
Tragic
18.8%
Apache
0.3
/100
|
#254
Tragic
18.8%
Immigrants | Cameroon
0.3
/100
|
#255
Tragic
18.8%
Mexican American Indians
0.3
/100
|
#256
Tragic
18.8%
Immigrants | Nigeria
0.2
/100
|
#257
Tragic
18.9%
Immigrants | Mexico
0.2
/100
|
#258
Tragic
18.9%
Immigrants | Central America
0.2
/100
|
#259
Tragic
18.9%
Nigerians
0.2
/100
|
#260
Tragic
18.9%
Spanish American Indians
0.1
/100
|
#261
Tragic
18.9%