American vs Immigrants from Panama Unemployment Among Ages 20 to 24 years
COMPARE
American
Immigrants from Panama
Unemployment Among Ages 20 to 24 years
Unemployment Among Ages 20 to 24 years Comparison
Americans
Immigrants from Panama
10.6%
UNEMPLOYMENT AMONG AGES 20 TO 24 YEARS
4.4/ 100
METRIC RATING
229th/ 347
METRIC RANK
10.8%
UNEMPLOYMENT AMONG AGES 20 TO 24 YEARS
0.4/ 100
METRIC RATING
251st/ 347
METRIC RANK
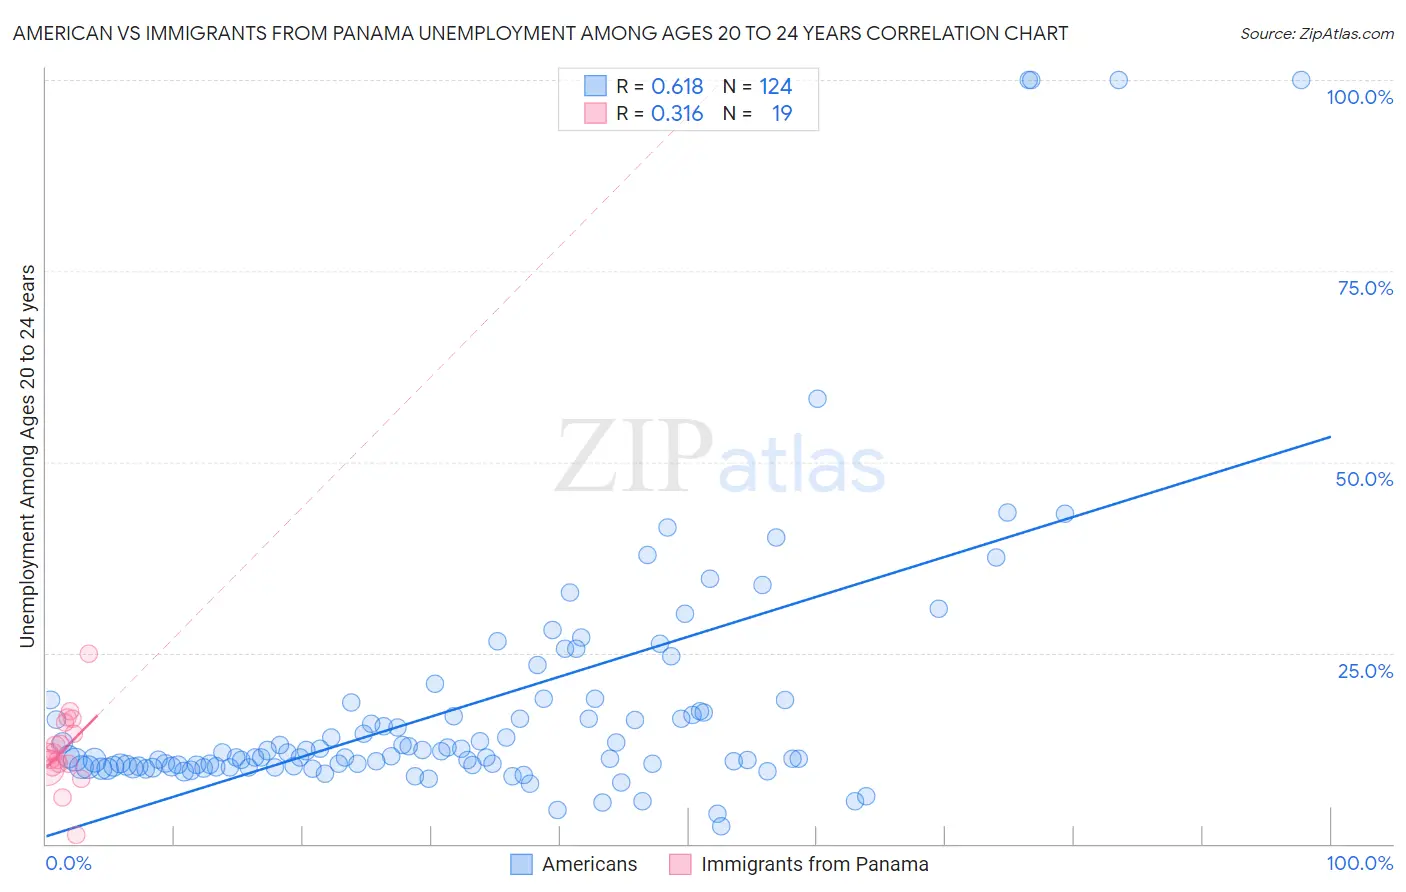
American vs Immigrants from Panama Unemployment Among Ages 20 to 24 years Correlation Chart
The statistical analysis conducted on geographies consisting of 529,663,619 people shows a significant positive correlation between the proportion of Americans and unemployment rate among population between the ages 20 and 24 in the United States with a correlation coefficient (R) of 0.618 and weighted average of 10.6%. Similarly, the statistical analysis conducted on geographies consisting of 218,334,503 people shows a mild positive correlation between the proportion of Immigrants from Panama and unemployment rate among population between the ages 20 and 24 in the United States with a correlation coefficient (R) of 0.316 and weighted average of 10.8%, a difference of 2.1%.
Unemployment Among Ages 20 to 24 years Correlation Summary
| Measurement | American | Immigrants from Panama |
| Minimum | 2.4% | 1.2% |
| Maximum | 100.0% | 24.9% |
| Range | 97.6% | 23.7% |
| Mean | 18.0% | 12.3% |
| Median | 11.4% | 11.7% |
| Interquartile 25% (IQ1) | 10.1% | 10.0% |
| Interquartile 75% (IQ3) | 17.3% | 15.9% |
| Interquartile Range (IQR) | 7.2% | 5.9% |
| Standard Deviation (Sample) | 17.7% | 4.9% |
| Standard Deviation (Population) | 17.6% | 4.8% |
Similar Demographics by Unemployment Among Ages 20 to 24 years
Demographics Similar to Americans by Unemployment Among Ages 20 to 24 years
In terms of unemployment among ages 20 to 24 years, the demographic groups most similar to Americans are Mexican American Indian (10.6%, a difference of 0.040%), French American Indian (10.6%, a difference of 0.060%), Immigrants from Costa Rica (10.6%, a difference of 0.11%), Palestinian (10.6%, a difference of 0.11%), and Native Hawaiian (10.6%, a difference of 0.11%).
| Demographics | Rating | Rank | Unemployment Among Ages 20 to 24 years |
| Immigrants | Poland | 6.4 /100 | #222 | Tragic 10.6% |
| Arabs | 5.6 /100 | #223 | Tragic 10.6% |
| Nepalese | 5.1 /100 | #224 | Tragic 10.6% |
| Immigrants | South America | 5.1 /100 | #225 | Tragic 10.6% |
| Immigrants | Costa Rica | 4.9 /100 | #226 | Tragic 10.6% |
| Palestinians | 4.9 /100 | #227 | Tragic 10.6% |
| Mexican American Indians | 4.6 /100 | #228 | Tragic 10.6% |
| Americans | 4.4 /100 | #229 | Tragic 10.6% |
| French American Indians | 4.1 /100 | #230 | Tragic 10.6% |
| Native Hawaiians | 3.9 /100 | #231 | Tragic 10.6% |
| Israelis | 3.7 /100 | #232 | Tragic 10.6% |
| Choctaw | 3.6 /100 | #233 | Tragic 10.6% |
| Immigrants | Africa | 3.5 /100 | #234 | Tragic 10.6% |
| Immigrants | Ukraine | 3.3 /100 | #235 | Tragic 10.6% |
| Mexicans | 3.2 /100 | #236 | Tragic 10.6% |
Demographics Similar to Immigrants from Panama by Unemployment Among Ages 20 to 24 years
In terms of unemployment among ages 20 to 24 years, the demographic groups most similar to Immigrants from Panama are Albanian (10.8%, a difference of 0.060%), Immigrants from Syria (10.8%, a difference of 0.060%), South American Indian (10.8%, a difference of 0.10%), Spanish American (10.8%, a difference of 0.12%), and Liberian (10.8%, a difference of 0.23%).
| Demographics | Rating | Rank | Unemployment Among Ages 20 to 24 years |
| Immigrants | Mexico | 1.2 /100 | #244 | Tragic 10.7% |
| Hispanics or Latinos | 1.0 /100 | #245 | Tragic 10.7% |
| Immigrants | Iran | 0.9 /100 | #246 | Tragic 10.8% |
| Immigrants | Albania | 0.7 /100 | #247 | Tragic 10.8% |
| Cree | 0.6 /100 | #248 | Tragic 10.8% |
| South American Indians | 0.5 /100 | #249 | Tragic 10.8% |
| Albanians | 0.5 /100 | #250 | Tragic 10.8% |
| Immigrants | Panama | 0.4 /100 | #251 | Tragic 10.8% |
| Immigrants | Syria | 0.4 /100 | #252 | Tragic 10.8% |
| Spanish Americans | 0.4 /100 | #253 | Tragic 10.8% |
| Liberians | 0.3 /100 | #254 | Tragic 10.8% |
| Immigrants | Israel | 0.3 /100 | #255 | Tragic 10.8% |
| Immigrants | Bahamas | 0.3 /100 | #256 | Tragic 10.9% |
| Immigrants | Western Asia | 0.3 /100 | #257 | Tragic 10.9% |
| Dutch West Indians | 0.3 /100 | #258 | Tragic 10.9% |