American vs Immigrants from Bahamas Unemployment Among Women with Children Under 6 years
COMPARE
American
Immigrants from Bahamas
Unemployment Among Women with Children Under 6 years
Unemployment Among Women with Children Under 6 years Comparison
Americans
Immigrants from Bahamas
9.3%
UNEMPLOYMENT AMONG WOMEN WITH CHILDREN UNDER 6 YEARS
0.0/ 100
METRIC RATING
313th/ 347
METRIC RANK
9.6%
UNEMPLOYMENT AMONG WOMEN WITH CHILDREN UNDER 6 YEARS
0.0/ 100
METRIC RATING
323rd/ 347
METRIC RANK
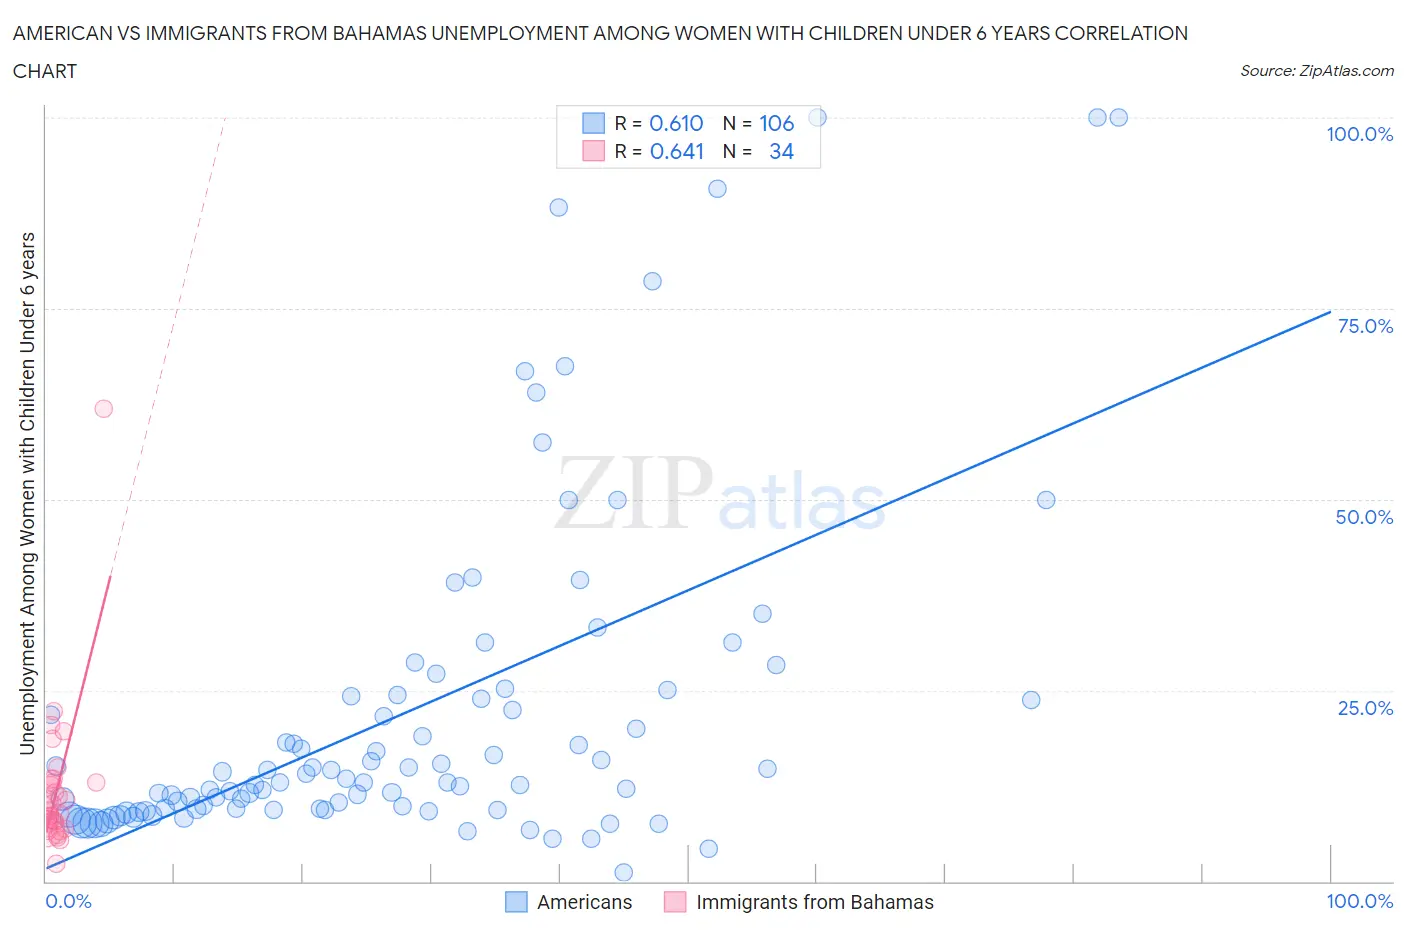
American vs Immigrants from Bahamas Unemployment Among Women with Children Under 6 years Correlation Chart
The statistical analysis conducted on geographies consisting of 380,925,631 people shows a significant positive correlation between the proportion of Americans and unemployment rate among women with children under the age of 6 in the United States with a correlation coefficient (R) of 0.610 and weighted average of 9.3%. Similarly, the statistical analysis conducted on geographies consisting of 94,063,271 people shows a significant positive correlation between the proportion of Immigrants from Bahamas and unemployment rate among women with children under the age of 6 in the United States with a correlation coefficient (R) of 0.641 and weighted average of 9.6%, a difference of 4.1%.
Unemployment Among Women with Children Under 6 years Correlation Summary
| Measurement | American | Immigrants from Bahamas |
| Minimum | 1.1% | 2.3% |
| Maximum | 100.0% | 61.8% |
| Range | 98.9% | 59.5% |
| Mean | 22.1% | 11.9% |
| Median | 12.9% | 9.3% |
| Interquartile 25% (IQ1) | 9.4% | 7.1% |
| Interquartile 75% (IQ3) | 24.2% | 12.9% |
| Interquartile Range (IQR) | 14.8% | 5.8% |
| Standard Deviation (Sample) | 22.1% | 9.9% |
| Standard Deviation (Population) | 21.9% | 9.8% |
Demographics Similar to Americans and Immigrants from Bahamas by Unemployment Among Women with Children Under 6 years
In terms of unemployment among women with children under 6 years, the demographic groups most similar to Americans are Fijian (9.3%, a difference of 0.030%), Immigrants from the Azores (9.2%, a difference of 0.44%), French American Indian (9.2%, a difference of 0.58%), Cherokee (9.3%, a difference of 0.80%), and Cajun (9.2%, a difference of 0.86%). Similarly, the demographic groups most similar to Immigrants from Bahamas are Alaska Native (9.6%, a difference of 0.19%), Central American Indian (9.6%, a difference of 0.44%), Potawatomi (9.6%, a difference of 0.50%), Marshallese (9.6%, a difference of 0.55%), and Paiute (9.7%, a difference of 0.70%).
| Demographics | Rating | Rank | Unemployment Among Women with Children Under 6 years |
| Immigrants | Micronesia | 0.0 /100 | #308 | Tragic 9.1% |
| Africans | 0.0 /100 | #309 | Tragic 9.2% |
| Cajuns | 0.0 /100 | #310 | Tragic 9.2% |
| French American Indians | 0.0 /100 | #311 | Tragic 9.2% |
| Immigrants | Azores | 0.0 /100 | #312 | Tragic 9.2% |
| Americans | 0.0 /100 | #313 | Tragic 9.3% |
| Fijians | 0.0 /100 | #314 | Tragic 9.3% |
| Cherokee | 0.0 /100 | #315 | Tragic 9.3% |
| Houma | 0.0 /100 | #316 | Tragic 9.4% |
| Dutch West Indians | 0.0 /100 | #317 | Tragic 9.5% |
| Osage | 0.0 /100 | #318 | Tragic 9.5% |
| Marshallese | 0.0 /100 | #319 | Tragic 9.6% |
| Potawatomi | 0.0 /100 | #320 | Tragic 9.6% |
| Central American Indians | 0.0 /100 | #321 | Tragic 9.6% |
| Alaska Natives | 0.0 /100 | #322 | Tragic 9.6% |
| Immigrants | Bahamas | 0.0 /100 | #323 | Tragic 9.6% |
| Paiute | 0.0 /100 | #324 | Tragic 9.7% |
| Choctaw | 0.0 /100 | #325 | Tragic 9.8% |
| Delaware | 0.0 /100 | #326 | Tragic 9.8% |
| Ottawa | 0.0 /100 | #327 | Tragic 9.9% |
| Tohono O'odham | 0.0 /100 | #328 | Tragic 10.2% |