Aleut vs Egyptian Unemployment Among Ages 45 to 54 years

COMPARE

Aleut
Race
Ancestry
AfghanAfricanAlaska NativeAlaskan AthabascanAlbanianAleutAlsatianAmericanApacheArabArapahoArgentineanArmenianAssyrian/Chaldean/SyriacAustralianAustrianBahamianBangladeshiBarbadianBasqueBelgianBelizeanBermudanBhutaneseBlackfeetBolivianBrazilianBritishBritish West IndianBulgarianBurmeseCajunCambodianCanadianCape VerdeanCarpatho RusynCelticCentral AmericanCentral American IndianCherokeeCheyenneChickasawChileanChineseChippewaChoctawColombianColvilleComancheCosta RicanCreeCreekCroatianCrowCubanCypriotCzechCzechoslovakianDanishDelawareDominicanDutchDutch West IndianEastern EuropeanEcuadorianEnglishEstonianEthiopianEuropeanFijianFilipinoFinnishFrenchFrench American IndianFrench CanadianGermanGerman RussianGhanaianGreekGuamanian/ChamorroGuatemalanGuyaneseHaitianHmongHonduranHopiHoumaHungarianIcelanderIndian (Asian)IndonesianInupiatIranianIraqiIrishIroquoisIsraeliItalianJamaicanJapaneseJordanianKenyanKiowaKoreanLaotianLatvianLebaneseLiberianLithuanianLumbeeLuxembourgerMacedonianMalaysianMalteseMarshalleseMenomineeMexicanMexican American IndianMongolianMoroccanNative HawaiianNavajoNepaleseNew ZealanderNicaraguanNigerianNorthern EuropeanNorwegianOkinawanOsageOttawaPaiutePakistaniPalestinianPanamanianParaguayanPennsylvania GermanPeruvianPimaPolishPortuguesePotawatomiPuebloPuerto RicanPuget Sound SalishRomanianRussianSalvadoranSamoanScandinavianScotch-IrishScottishSeminoleSenegaleseSerbianShoshoneSierra LeoneanSiouxSlavicSlovakSloveneSomaliSouth AfricanSouth AmericanSouth American IndianSoviet UnionSpaniardSpanishSpanish AmericanSpanish American IndianSri LankanSubsaharan AfricanSudaneseSwedishSwissSyrianTaiwaneseThaiTlingit-HaidaTohono O'OdhamTonganTrinidadian and TobagonianTsimshianTurkishU.S. Virgin IslanderUgandanUkrainianUruguayanUteVenezuelanVietnameseWelshWest IndianYakamaYaquiYugoslavianYumanYup'ikZimbabwean
Immigration
NonimmigrantsImmigrantsAfghanistanAfricaAlbaniaArgentinaArmeniaAsiaAustraliaAustriaBahamasBangladeshBarbadosBelarusBelgiumBelizeBoliviaBosnia and HerzegovinaBrazilBulgariaBurma/MyanmarCabo VerdeCambodiaCameroonCanadaCaribbeanCentral AmericaChileChinaColombiaCongoCosta RicaCroatiaCubaCzechoslovakiaDenmarkDominicaDominican RepublicEastern AfricaEastern AsiaEastern EuropeEcuadorEgyptEl SalvadorEnglandEritreaEthiopiaEuropeFijiFranceGermanyGhanaGreeceGrenadaGuatemalaGuyanaHaitiHondurasHong KongHungaryIndiaIndonesiaIranIraqIrelandIsraelItalyJamaicaJapanJordanKazakhstanKenyaKoreaKuwaitLaosLatin AmericaLatviaLebanonLiberiaLithuaniaMalaysiaMexicoMicronesiaMiddle AfricaMoldovaMoroccoNepalNetherlandsNicaraguaNigeriaNorth AmericaNorth MacedoniaNorthern AfricaNorthern EuropeNorwayOceaniaPakistanPanamaPeruPhilippinesPolandPortugalRomaniaRussiaSaudi ArabiaScotlandSenegalSerbiaSierra LeoneSingaporeSomaliaSouth AfricaSouth AmericaSouth Central AsiaSouth Eastern AsiaSouthern EuropeSpainSri LankaSt. Vincent and the GrenadinesSudanSwedenSwitzerlandSyriaTaiwanThailandTrinidad and TobagoTurkeyUgandaUkraineUruguayUzbekistanVenezuelaVietnamWest IndiesWestern AfricaWestern AsiaWestern EuropeYemenZaireZimbabweAzores
Egyptian
Race
Ancestry
AfghanAfricanAlaska NativeAlaskan AthabascanAlbanianAlsatianAmericanApacheArabArapahoArgentineanArmenianAssyrian/Chaldean/SyriacAustralianAustrianBahamianBangladeshiBarbadianBasqueBelgianBelizeanBermudanBhutaneseBlackfeetBolivianBrazilianBritishBritish West IndianBulgarianBurmeseCajunCambodianCanadianCape VerdeanCarpatho RusynCelticCentral AmericanCentral American IndianCherokeeCheyenneChickasawChileanChineseChippewaChoctawColombianColvilleComancheCosta RicanCreeCreekCroatianCrowCubanCypriotCzechCzechoslovakianDanishDelawareDominicanDutchDutch West IndianEastern EuropeanEcuadorianEgyptianEnglishEstonianEthiopianEuropeanFijianFilipinoFinnishFrenchFrench American IndianFrench CanadianGermanGerman RussianGhanaianGreekGuamanian/ChamorroGuatemalanGuyaneseHaitianHmongHonduranHopiHoumaHungarianIcelanderIndian (Asian)IndonesianInupiatIranianIraqiIrishIroquoisIsraeliItalianJamaicanJapaneseJordanianKenyanKiowaKoreanLaotianLatvianLebaneseLiberianLithuanianLumbeeLuxembourgerMacedonianMalaysianMalteseMarshalleseMenomineeMexicanMexican American IndianMongolianMoroccanNative HawaiianNavajoNepaleseNew ZealanderNicaraguanNigerianNorthern EuropeanNorwegianOkinawanOsageOttawaPaiutePakistaniPalestinianPanamanianParaguayanPennsylvania GermanPeruvianPimaPolishPortuguesePotawatomiPuebloPuerto RicanPuget Sound SalishRomanianRussianSalvadoranSamoanScandinavianScotch-IrishScottishSeminoleSenegaleseSerbianShoshoneSierra LeoneanSiouxSlavicSlovakSloveneSomaliSouth AfricanSouth AmericanSouth American IndianSoviet UnionSpaniardSpanishSpanish AmericanSpanish American IndianSri LankanSubsaharan AfricanSudaneseSwedishSwissSyrianTaiwaneseThaiTlingit-HaidaTohono O'OdhamTonganTrinidadian and TobagonianTsimshianTurkishU.S. Virgin IslanderUgandanUkrainianUruguayanUteVenezuelanVietnameseWelshWest IndianYakamaYaquiYugoslavianYumanYup'ikZimbabwean
Immigration
NonimmigrantsImmigrantsAfghanistanAfricaAlbaniaArgentinaArmeniaAsiaAustraliaAustriaBahamasBangladeshBarbadosBelarusBelgiumBelizeBoliviaBosnia and HerzegovinaBrazilBulgariaBurma/MyanmarCabo VerdeCambodiaCameroonCanadaCaribbeanCentral AmericaChileChinaColombiaCongoCosta RicaCroatiaCubaCzechoslovakiaDenmarkDominicaDominican RepublicEastern AfricaEastern AsiaEastern EuropeEcuadorEgyptEl SalvadorEnglandEritreaEthiopiaEuropeFijiFranceGermanyGhanaGreeceGrenadaGuatemalaGuyanaHaitiHondurasHong KongHungaryIndiaIndonesiaIranIraqIrelandIsraelItalyJamaicaJapanJordanKazakhstanKenyaKoreaKuwaitLaosLatin AmericaLatviaLebanonLiberiaLithuaniaMalaysiaMexicoMicronesiaMiddle AfricaMoldovaMoroccoNepalNetherlandsNicaraguaNigeriaNorth AmericaNorth MacedoniaNorthern AfricaNorthern EuropeNorwayOceaniaPakistanPanamaPeruPhilippinesPolandPortugalRomaniaRussiaSaudi ArabiaScotlandSenegalSerbiaSierra LeoneSingaporeSomaliaSouth AfricaSouth AmericaSouth Central AsiaSouth Eastern AsiaSouthern EuropeSpainSri LankaSt. Vincent and the GrenadinesSudanSwedenSwitzerlandSyriaTaiwanThailandTrinidad and TobagoTurkeyUgandaUkraineUruguayUzbekistanVenezuelaVietnamWest IndiesWestern AfricaWestern AsiaWestern EuropeYemenZaireZimbabweAzores
Unemployment Among Ages 45 to 54 years
Income
Poverty
Unemployment
Labor Participation
Family Structure
Vehicle Availability
Education Level
Disability

Unemployment Among Ages 45 to 54 years Comparison

Aleuts

Egyptians

Tragic
Average
5.3%
UNEMPLOYMENT AMONG AGES 45 TO 54 YEARS
0.0/ 100
METRIC RATING
296th/ 347
METRIC RANK
4.5%
UNEMPLOYMENT AMONG AGES 45 TO 54 YEARS
53.6/ 100
METRIC RATING
171st/ 347
METRIC RANK

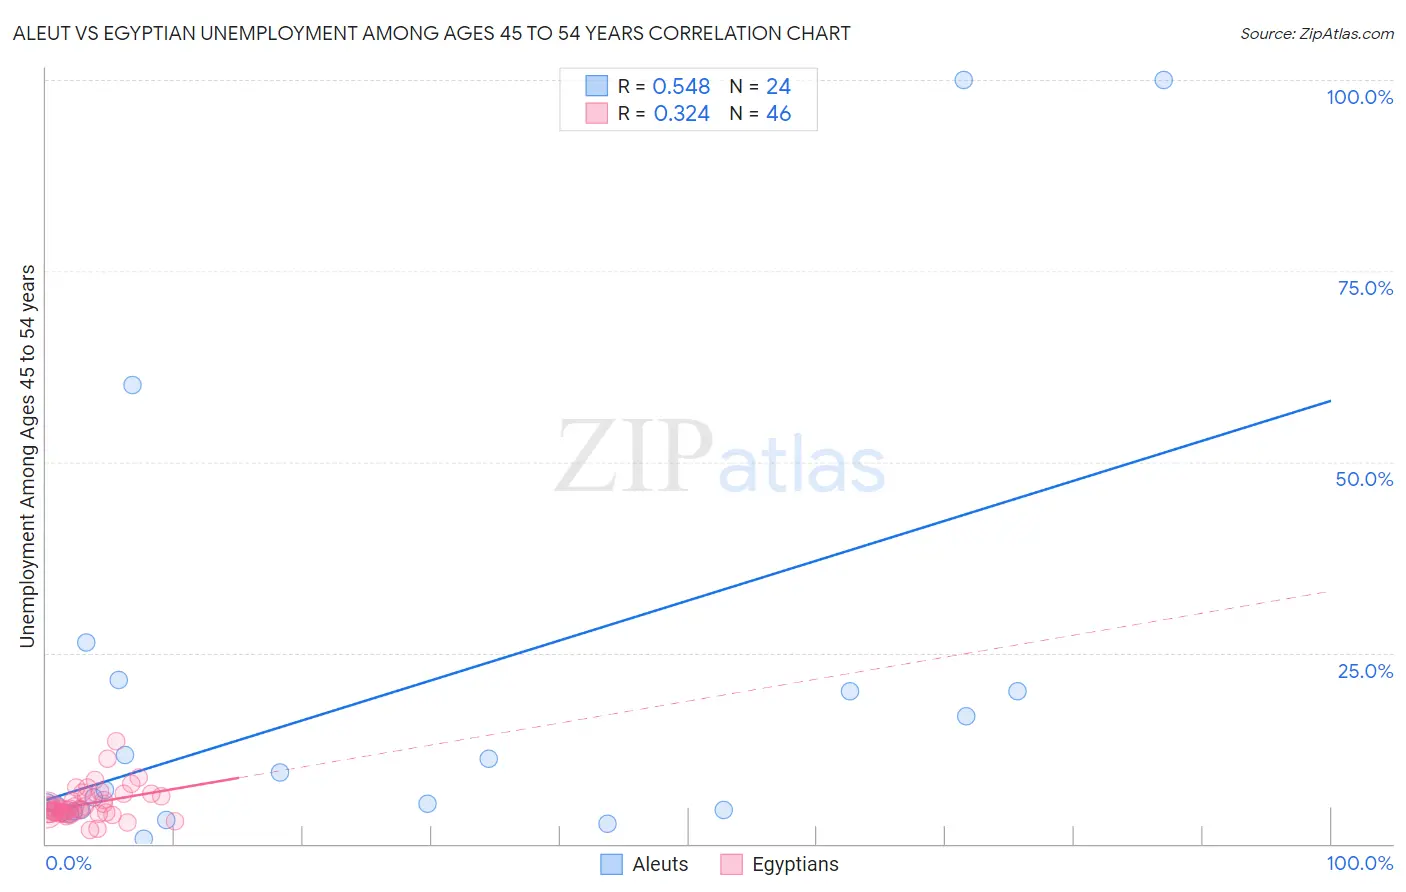
Aleut vs Egyptian Unemployment Among Ages 45 to 54 years Correlation Chart

The statistical analysis conducted on geographies consisting of 61,425,892 people shows a substantial positive correlation between the proportion of Aleuts and unemployment rate among population between the ages 45 and 54 in the United States with a correlation coefficient (R) of 0.548 and weighted average of 5.3%. Similarly, the statistical analysis conducted on geographies consisting of 272,921,449 people shows a mild positive correlation between the proportion of Egyptians and unemployment rate among population between the ages 45 and 54 in the United States with a correlation coefficient (R) of 0.324 and weighted average of 4.5%, a difference of 16.6%.
Aleut vs Egyptian Unemployment Among Ages 45 to 54 years

Unemployment Among Ages 45 to 54 years Correlation Summary

MeasurementAleutEgyptian
Minimum0.70%1.8%
Maximum100.0%13.4%
Range99.3%11.6%
Mean18.9%5.2%
Median6.5%4.5%
Interquartile 25% (IQ1)4.3%4.1%
Interquartile 75% (IQ3)20.0%6.3%
Interquartile Range (IQR)15.7%2.2%
Standard Deviation (Sample)27.9%2.2%
Standard Deviation (Population)27.3%2.1%

Similar Demographics by Unemployment Among Ages 45 to 54 years

Demographics Similar to Aleuts by Unemployment Among Ages 45 to 54 years

In terms of unemployment among ages 45 to 54 years, the demographic groups most similar to Aleuts are West Indian (5.3%, a difference of 0.0%), Immigrants from Trinidad and Tobago (5.3%, a difference of 0.12%), Ecuadorian (5.3%, a difference of 0.14%), Jamaican (5.3%, a difference of 0.18%), and Belizean (5.2%, a difference of 0.33%).
DemographicsRating | RankUnemployment Among Ages 45 to 54 years
Immigrants | Haiti
0.0
/100
|
#289
Tragic
5.2%
Immigrants | Portugal
0.0
/100
|
#290
Tragic
5.2%
Armenians
0.0
/100
|
#291
Tragic
5.2%
Trinidadians and Tobagonians
0.0
/100
|
#292
Tragic
5.2%
Immigrants | Senegal
0.0
/100
|
#293
Tragic
5.2%
Belizeans
0.0
/100
|
#294
Tragic
5.2%
Jamaicans
0.0
/100
|
#295
Tragic
5.3%
Aleuts
0.0
/100
|
#296
Tragic
5.3%
West Indians
0.0
/100
|
#297
Tragic
5.3%
Immigrants | Trinidad and Tobago
0.0
/100
|
#298
Tragic
5.3%
Ecuadorians
0.0
/100
|
#299
Tragic
5.3%
Central American Indians
0.0
/100
|
#300
Tragic
5.3%
Menominee
0.0
/100
|
#301
Tragic
5.3%
Immigrants | Ecuador
0.0
/100
|
#302
Tragic
5.3%
Immigrants | Belize
0.0
/100
|
#303
Tragic
5.3%

Demographics Similar to Egyptians by Unemployment Among Ages 45 to 54 years

In terms of unemployment among ages 45 to 54 years, the demographic groups most similar to Egyptians are Colombian (4.5%, a difference of 0.010%), Spaniard (4.5%, a difference of 0.030%), Immigrants from Europe (4.5%, a difference of 0.050%), Immigrants from Egypt (4.5%, a difference of 0.050%), and Immigrants from Colombia (4.5%, a difference of 0.070%).
DemographicsRating | RankUnemployment Among Ages 45 to 54 years
Samoans
58.5
/100
|
#164
Average
4.5%
Maltese
57.9
/100
|
#165
Average
4.5%
Immigrants | Western Europe
57.4
/100
|
#166
Average
4.5%
Immigrants | Brazil
56.4
/100
|
#167
Average
4.5%
Immigrants | Europe
54.7
/100
|
#168
Average
4.5%
Immigrants | Egypt
54.7
/100
|
#169
Average
4.5%
Spaniards
54.3
/100
|
#170
Average
4.5%
Egyptians
53.6
/100
|
#171
Average
4.5%
Colombians
53.3
/100
|
#172
Average
4.5%
Immigrants | Colombia
52.0
/100
|
#173
Average
4.5%
Immigrants | Hungary
50.0
/100
|
#174
Average
4.5%
Immigrants | France
49.4
/100
|
#175
Average
4.5%
Puget Sound Salish
49.1
/100
|
#176
Average
4.5%
Immigrants | Northern Africa
49.0
/100
|
#177
Average
4.5%
Immigrants | Australia
48.5
/100
|
#178
Average
4.5%