Albanian vs Tlingit-Haida Female Unemployment
COMPARE
Albanian
Tlingit-Haida
Female Unemployment
Female Unemployment Comparison
Albanians
Tlingit-Haida
5.2%
FEMALE UNEMPLOYMENT
68.3/ 100
METRIC RATING
158th/ 347
METRIC RANK
4.9%
FEMALE UNEMPLOYMENT
98.3/ 100
METRIC RATING
68th/ 347
METRIC RANK
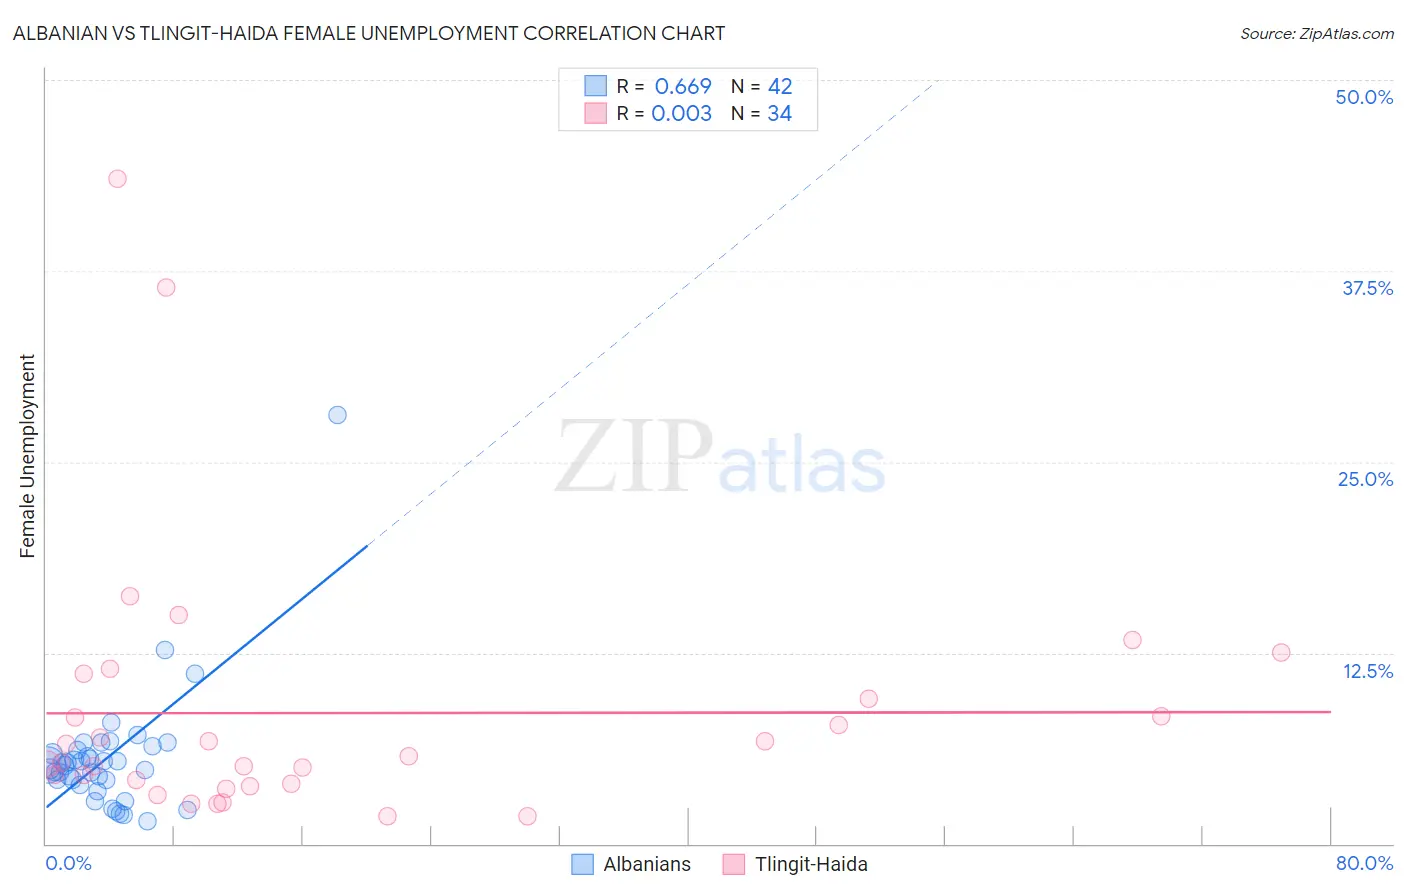
Albanian vs Tlingit-Haida Female Unemployment Correlation Chart
The statistical analysis conducted on geographies consisting of 192,822,109 people shows a significant positive correlation between the proportion of Albanians and unemploymnet rate among females in the United States with a correlation coefficient (R) of 0.669 and weighted average of 5.2%. Similarly, the statistical analysis conducted on geographies consisting of 60,741,997 people shows no correlation between the proportion of Tlingit-Haida and unemploymnet rate among females in the United States with a correlation coefficient (R) of 0.003 and weighted average of 4.9%, a difference of 5.2%.
Female Unemployment Correlation Summary
| Measurement | Albanian | Tlingit-Haida |
| Minimum | 1.5% | 1.8% |
| Maximum | 28.1% | 43.5% |
| Range | 26.6% | 41.7% |
| Mean | 5.6% | 8.6% |
| Median | 5.2% | 5.5% |
| Interquartile 25% (IQ1) | 4.2% | 3.9% |
| Interquartile 75% (IQ3) | 6.1% | 9.5% |
| Interquartile Range (IQR) | 1.9% | 5.6% |
| Standard Deviation (Sample) | 4.2% | 8.8% |
| Standard Deviation (Population) | 4.1% | 8.7% |
Similar Demographics by Female Unemployment
Demographics Similar to Albanians by Female Unemployment
In terms of female unemployment, the demographic groups most similar to Albanians are Immigrants from Russia (5.2%, a difference of 0.070%), Immigrants from Northern Africa (5.2%, a difference of 0.10%), Immigrants from Micronesia (5.2%, a difference of 0.10%), Immigrants from Spain (5.2%, a difference of 0.11%), and Immigrants from Pakistan (5.2%, a difference of 0.11%).
| Demographics | Rating | Rank | Female Unemployment |
| Immigrants | China | 75.9 /100 | #151 | Good 5.2% |
| Immigrants | Italy | 75.0 /100 | #152 | Good 5.2% |
| Immigrants | Greece | 74.9 /100 | #153 | Good 5.2% |
| South Africans | 70.8 /100 | #154 | Good 5.2% |
| Immigrants | Egypt | 70.0 /100 | #155 | Good 5.2% |
| Immigrants | Northern Africa | 69.6 /100 | #156 | Good 5.2% |
| Immigrants | Russia | 69.3 /100 | #157 | Good 5.2% |
| Albanians | 68.3 /100 | #158 | Good 5.2% |
| Immigrants | Micronesia | 66.9 /100 | #159 | Good 5.2% |
| Immigrants | Spain | 66.8 /100 | #160 | Good 5.2% |
| Immigrants | Pakistan | 66.7 /100 | #161 | Good 5.2% |
| Potawatomi | 65.9 /100 | #162 | Good 5.2% |
| Immigrants | Asia | 64.3 /100 | #163 | Good 5.2% |
| Bangladeshis | 64.3 /100 | #164 | Good 5.2% |
| Syrians | 62.8 /100 | #165 | Good 5.2% |
Demographics Similar to Tlingit-Haida by Female Unemployment
In terms of female unemployment, the demographic groups most similar to Tlingit-Haida are Hungarian (4.9%, a difference of 0.010%), Cuban (4.9%, a difference of 0.010%), Immigrants from Ireland (4.9%, a difference of 0.010%), Immigrants from North America (4.9%, a difference of 0.040%), and Osage (4.9%, a difference of 0.050%).
| Demographics | Rating | Rank | Female Unemployment |
| Immigrants | Canada | 98.6 /100 | #61 | Exceptional 4.9% |
| Immigrants | Nepal | 98.6 /100 | #62 | Exceptional 4.9% |
| Immigrants | Belgium | 98.5 /100 | #63 | Exceptional 4.9% |
| Celtics | 98.5 /100 | #64 | Exceptional 4.9% |
| Immigrants | North America | 98.3 /100 | #65 | Exceptional 4.9% |
| Hungarians | 98.3 /100 | #66 | Exceptional 4.9% |
| Cubans | 98.3 /100 | #67 | Exceptional 4.9% |
| Tlingit-Haida | 98.3 /100 | #68 | Exceptional 4.9% |
| Immigrants | Ireland | 98.2 /100 | #69 | Exceptional 4.9% |
| Osage | 98.2 /100 | #70 | Exceptional 4.9% |
| German Russians | 98.1 /100 | #71 | Exceptional 4.9% |
| Immigrants | Northern Europe | 98.0 /100 | #72 | Exceptional 4.9% |
| Russians | 98.0 /100 | #73 | Exceptional 5.0% |
| Immigrants | Bolivia | 98.0 /100 | #74 | Exceptional 5.0% |
| Immigrants | Singapore | 98.0 /100 | #75 | Exceptional 5.0% |