Albanian vs Immigrants from Jamaica Unemployment Among Ages 45 to 54 years

COMPARE

Albanian
Race
Ancestry
AfghanAfricanAlaska NativeAlaskan AthabascanAlbanianAleutAlsatianAmericanApacheArabArapahoArgentineanArmenianAssyrian/Chaldean/SyriacAustralianAustrianBahamianBangladeshiBarbadianBasqueBelgianBelizeanBermudanBhutaneseBlackfeetBolivianBrazilianBritishBritish West IndianBulgarianBurmeseCajunCambodianCanadianCape VerdeanCarpatho RusynCelticCentral AmericanCentral American IndianCherokeeCheyenneChickasawChileanChineseChippewaChoctawColombianColvilleComancheCosta RicanCreeCreekCroatianCrowCubanCypriotCzechCzechoslovakianDanishDelawareDominicanDutchDutch West IndianEastern EuropeanEcuadorianEgyptianEnglishEstonianEthiopianEuropeanFijianFilipinoFinnishFrenchFrench American IndianFrench CanadianGermanGerman RussianGhanaianGreekGuamanian/ChamorroGuatemalanGuyaneseHaitianHmongHonduranHopiHoumaHungarianIcelanderIndian (Asian)IndonesianInupiatIranianIraqiIrishIroquoisIsraeliItalianJamaicanJapaneseJordanianKenyanKiowaKoreanLaotianLatvianLebaneseLiberianLithuanianLumbeeLuxembourgerMacedonianMalaysianMalteseMarshalleseMenomineeMexicanMexican American IndianMongolianMoroccanNative HawaiianNavajoNepaleseNew ZealanderNicaraguanNigerianNorthern EuropeanNorwegianOkinawanOsageOttawaPaiutePakistaniPalestinianPanamanianParaguayanPennsylvania GermanPeruvianPimaPolishPortuguesePotawatomiPuebloPuerto RicanPuget Sound SalishRomanianRussianSalvadoranSamoanScandinavianScotch-IrishScottishSeminoleSenegaleseSerbianShoshoneSierra LeoneanSiouxSlavicSlovakSloveneSomaliSouth AfricanSouth AmericanSouth American IndianSoviet UnionSpaniardSpanishSpanish AmericanSpanish American IndianSri LankanSubsaharan AfricanSudaneseSwedishSwissSyrianTaiwaneseThaiTlingit-HaidaTohono O'OdhamTonganTrinidadian and TobagonianTsimshianTurkishU.S. Virgin IslanderUgandanUkrainianUruguayanUteVenezuelanVietnameseWelshWest IndianYakamaYaquiYugoslavianYumanYup'ikZimbabwean
Immigration
NonimmigrantsImmigrantsAfghanistanAfricaAlbaniaArgentinaArmeniaAsiaAustraliaAustriaBahamasBangladeshBarbadosBelarusBelgiumBelizeBoliviaBosnia and HerzegovinaBrazilBulgariaBurma/MyanmarCabo VerdeCambodiaCameroonCanadaCaribbeanCentral AmericaChileChinaColombiaCongoCosta RicaCroatiaCubaCzechoslovakiaDenmarkDominicaDominican RepublicEastern AfricaEastern AsiaEastern EuropeEcuadorEgyptEl SalvadorEnglandEritreaEthiopiaEuropeFijiFranceGermanyGhanaGreeceGrenadaGuatemalaGuyanaHaitiHondurasHong KongHungaryIndiaIndonesiaIranIraqIrelandIsraelItalyJapanJordanKazakhstanKenyaKoreaKuwaitLaosLatin AmericaLatviaLebanonLiberiaLithuaniaMalaysiaMexicoMicronesiaMiddle AfricaMoldovaMoroccoNepalNetherlandsNicaraguaNigeriaNorth AmericaNorth MacedoniaNorthern AfricaNorthern EuropeNorwayOceaniaPakistanPanamaPeruPhilippinesPolandPortugalRomaniaRussiaSaudi ArabiaScotlandSenegalSerbiaSierra LeoneSingaporeSomaliaSouth AfricaSouth AmericaSouth Central AsiaSouth Eastern AsiaSouthern EuropeSpainSri LankaSt. Vincent and the GrenadinesSudanSwedenSwitzerlandSyriaTaiwanThailandTrinidad and TobagoTurkeyUgandaUkraineUruguayUzbekistanVenezuelaVietnamWest IndiesWestern AfricaWestern AsiaWestern EuropeYemenZaireZimbabweAzores
Immigrants from Jamaica
Race
Ancestry
AfghanAfricanAlaska NativeAlaskan AthabascanAleutAlsatianAmericanApacheArabArapahoArgentineanArmenianAssyrian/Chaldean/SyriacAustralianAustrianBahamianBangladeshiBarbadianBasqueBelgianBelizeanBermudanBhutaneseBlackfeetBolivianBrazilianBritishBritish West IndianBulgarianBurmeseCajunCambodianCanadianCape VerdeanCarpatho RusynCelticCentral AmericanCentral American IndianCherokeeCheyenneChickasawChileanChineseChippewaChoctawColombianColvilleComancheCosta RicanCreeCreekCroatianCrowCubanCypriotCzechCzechoslovakianDanishDelawareDominicanDutchDutch West IndianEastern EuropeanEcuadorianEgyptianEnglishEstonianEthiopianEuropeanFijianFilipinoFinnishFrenchFrench American IndianFrench CanadianGermanGerman RussianGhanaianGreekGuamanian/ChamorroGuatemalanGuyaneseHaitianHmongHonduranHopiHoumaHungarianIcelanderIndian (Asian)IndonesianInupiatIranianIraqiIrishIroquoisIsraeliItalianJamaicanJapaneseJordanianKenyanKiowaKoreanLaotianLatvianLebaneseLiberianLithuanianLumbeeLuxembourgerMacedonianMalaysianMalteseMarshalleseMenomineeMexicanMexican American IndianMongolianMoroccanNative HawaiianNavajoNepaleseNew ZealanderNicaraguanNigerianNorthern EuropeanNorwegianOkinawanOsageOttawaPaiutePakistaniPalestinianPanamanianParaguayanPennsylvania GermanPeruvianPimaPolishPortuguesePotawatomiPuebloPuerto RicanPuget Sound SalishRomanianRussianSalvadoranSamoanScandinavianScotch-IrishScottishSeminoleSenegaleseSerbianShoshoneSierra LeoneanSiouxSlavicSlovakSloveneSomaliSouth AfricanSouth AmericanSouth American IndianSoviet UnionSpaniardSpanishSpanish AmericanSpanish American IndianSri LankanSubsaharan AfricanSudaneseSwedishSwissSyrianTaiwaneseThaiTlingit-HaidaTohono O'OdhamTonganTrinidadian and TobagonianTsimshianTurkishU.S. Virgin IslanderUgandanUkrainianUruguayanUteVenezuelanVietnameseWelshWest IndianYakamaYaquiYugoslavianYumanYup'ikZimbabwean
Immigration
NonimmigrantsImmigrantsAfghanistanAfricaAlbaniaArgentinaArmeniaAsiaAustraliaAustriaBahamasBangladeshBarbadosBelarusBelgiumBelizeBoliviaBosnia and HerzegovinaBrazilBulgariaBurma/MyanmarCabo VerdeCambodiaCameroonCanadaCaribbeanCentral AmericaChileChinaColombiaCongoCosta RicaCroatiaCubaCzechoslovakiaDenmarkDominicaDominican RepublicEastern AfricaEastern AsiaEastern EuropeEcuadorEgyptEl SalvadorEnglandEritreaEthiopiaEuropeFijiFranceGermanyGhanaGreeceGrenadaGuatemalaGuyanaHaitiHondurasHong KongHungaryIndiaIndonesiaIranIraqIrelandIsraelItalyJamaicaJapanJordanKazakhstanKenyaKoreaKuwaitLaosLatin AmericaLatviaLebanonLiberiaLithuaniaMalaysiaMexicoMicronesiaMiddle AfricaMoldovaMoroccoNepalNetherlandsNicaraguaNigeriaNorth AmericaNorth MacedoniaNorthern AfricaNorthern EuropeNorwayOceaniaPakistanPanamaPeruPhilippinesPolandPortugalRomaniaRussiaSaudi ArabiaScotlandSenegalSerbiaSierra LeoneSingaporeSomaliaSouth AfricaSouth AmericaSouth Central AsiaSouth Eastern AsiaSouthern EuropeSpainSri LankaSt. Vincent and the GrenadinesSudanSwedenSwitzerlandSyriaTaiwanThailandTrinidad and TobagoTurkeyUgandaUkraineUruguayUzbekistanVenezuelaVietnamWest IndiesWestern AfricaWestern AsiaWestern EuropeYemenZaireZimbabweAzores
Unemployment Among Ages 45 to 54 years
Income
Poverty
Unemployment
Labor Participation
Family Structure
Vehicle Availability
Education Level
Disability

Unemployment Among Ages 45 to 54 years Comparison

Albanians

Immigrants from Jamaica

Fair
Tragic
4.6%
UNEMPLOYMENT AMONG AGES 45 TO 54 YEARS
31.1/ 100
METRIC RATING
197th/ 347
METRIC RANK
5.4%
UNEMPLOYMENT AMONG AGES 45 TO 54 YEARS
0.0/ 100
METRIC RATING
304th/ 347
METRIC RANK

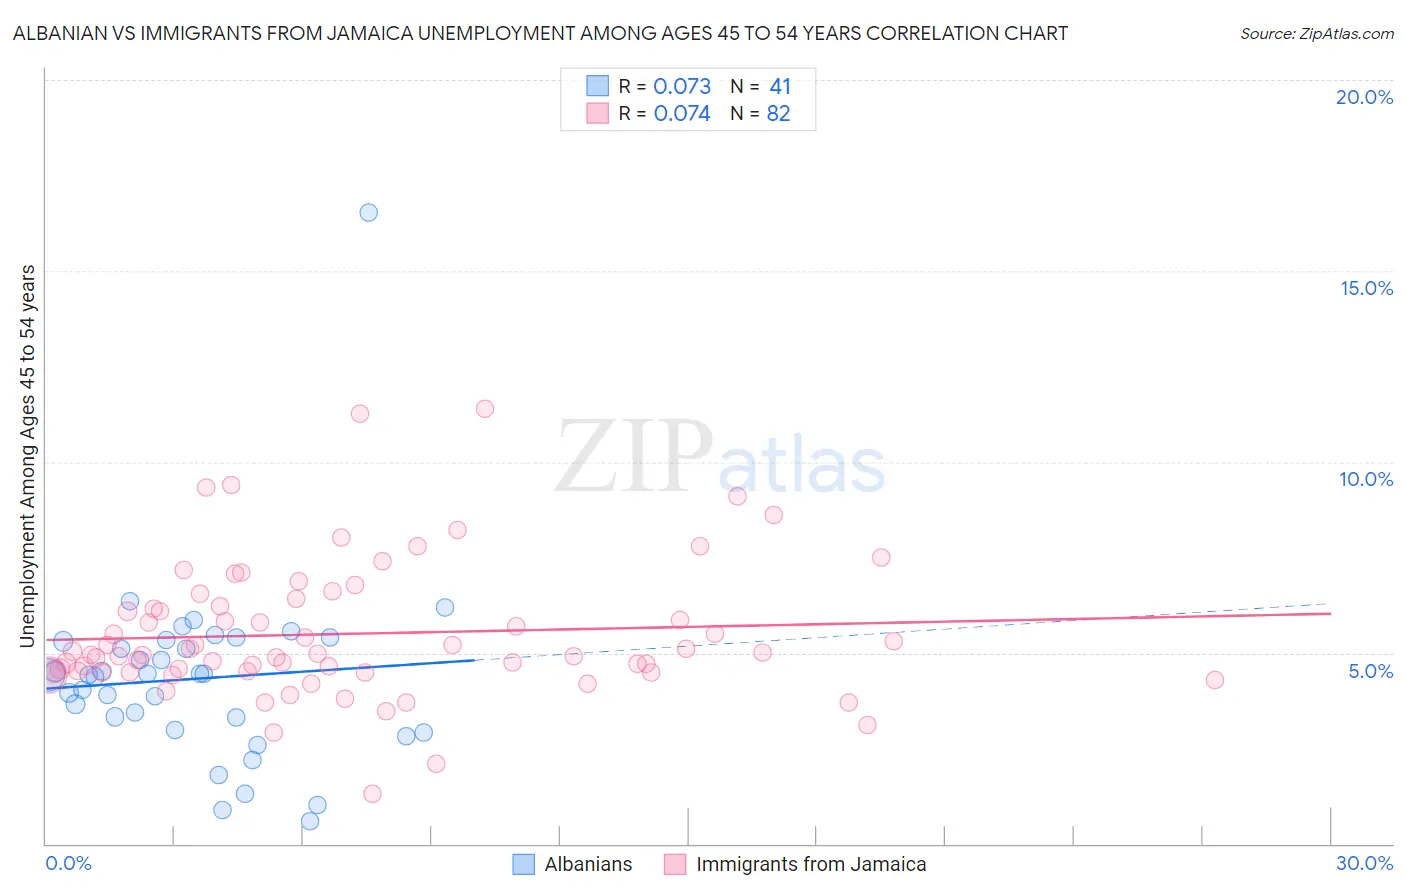
Albanian vs Immigrants from Jamaica Unemployment Among Ages 45 to 54 years Correlation Chart

The statistical analysis conducted on geographies consisting of 190,406,740 people shows a slight positive correlation between the proportion of Albanians and unemployment rate among population between the ages 45 and 54 in the United States with a correlation coefficient (R) of 0.073 and weighted average of 4.6%. Similarly, the statistical analysis conducted on geographies consisting of 296,481,042 people shows a slight positive correlation between the proportion of Immigrants from Jamaica and unemployment rate among population between the ages 45 and 54 in the United States with a correlation coefficient (R) of 0.074 and weighted average of 5.4%, a difference of 17.3%.
Albanian vs Immigrants from Jamaica Unemployment Among Ages 45 to 54 years

Unemployment Among Ages 45 to 54 years Correlation Summary

MeasurementAlbanianImmigrants from Jamaica
Minimum0.60%1.3%
Maximum16.5%11.4%
Range15.9%10.1%
Mean4.3%5.5%
Median4.4%4.9%
Interquartile 25% (IQ1)3.1%4.5%
Interquartile 75% (IQ3)5.3%6.2%
Interquartile Range (IQR)2.2%1.7%
Standard Deviation (Sample)2.4%1.8%
Standard Deviation (Population)2.4%1.8%

Similar Demographics by Unemployment Among Ages 45 to 54 years

Demographics Similar to Albanians by Unemployment Among Ages 45 to 54 years

In terms of unemployment among ages 45 to 54 years, the demographic groups most similar to Albanians are Estonian (4.6%, a difference of 0.010%), Peruvian (4.6%, a difference of 0.020%), Immigrants from Belarus (4.6%, a difference of 0.020%), South American (4.6%, a difference of 0.10%), and Immigrants from Lithuania (4.6%, a difference of 0.11%).
DemographicsRating | RankUnemployment Among Ages 45 to 54 years
Immigrants | Serbia
34.8
/100
|
#190
Fair
4.6%
Immigrants | Uruguay
34.4
/100
|
#191
Fair
4.6%
Immigrants | Thailand
34.1
/100
|
#192
Fair
4.6%
Immigrants | Lithuania
33.2
/100
|
#193
Fair
4.6%
South Americans
32.9
/100
|
#194
Fair
4.6%
Peruvians
31.5
/100
|
#195
Fair
4.6%
Estonians
31.2
/100
|
#196
Fair
4.6%
Albanians
31.1
/100
|
#197
Fair
4.6%
Immigrants | Belarus
30.6
/100
|
#198
Fair
4.6%
Brazilians
20.1
/100
|
#199
Fair
4.6%
Immigrants | Denmark
19.8
/100
|
#200
Poor
4.6%
Immigrants | Costa Rica
19.7
/100
|
#201
Poor
4.6%
Immigrants | Peru
19.1
/100
|
#202
Poor
4.6%
Liberians
18.7
/100
|
#203
Poor
4.6%
Immigrants | Morocco
16.8
/100
|
#204
Poor
4.6%

Demographics Similar to Immigrants from Jamaica by Unemployment Among Ages 45 to 54 years

In terms of unemployment among ages 45 to 54 years, the demographic groups most similar to Immigrants from Jamaica are Immigrants from West Indies (5.4%, a difference of 0.17%), Immigrants from Belize (5.3%, a difference of 0.18%), Immigrants from Ecuador (5.3%, a difference of 0.27%), Immigrants from Bangladesh (5.4%, a difference of 0.33%), and Vietnamese (5.4%, a difference of 0.59%).
DemographicsRating | RankUnemployment Among Ages 45 to 54 years
West Indians
0.0
/100
|
#297
Tragic
5.3%
Immigrants | Trinidad and Tobago
0.0
/100
|
#298
Tragic
5.3%
Ecuadorians
0.0
/100
|
#299
Tragic
5.3%
Central American Indians
0.0
/100
|
#300
Tragic
5.3%
Menominee
0.0
/100
|
#301
Tragic
5.3%
Immigrants | Ecuador
0.0
/100
|
#302
Tragic
5.3%
Immigrants | Belize
0.0
/100
|
#303
Tragic
5.3%
Immigrants | Jamaica
0.0
/100
|
#304
Tragic
5.4%
Immigrants | West Indies
0.0
/100
|
#305
Tragic
5.4%
Immigrants | Bangladesh
0.0
/100
|
#306
Tragic
5.4%
Vietnamese
0.0
/100
|
#307
Tragic
5.4%
Blacks/African Americans
0.0
/100
|
#308
Tragic
5.4%
Barbadians
0.0
/100
|
#309
Tragic
5.5%
Immigrants | Barbados
0.0
/100
|
#310
Tragic
5.5%
Chippewa
0.0
/100
|
#311
Tragic
5.5%