Alaskan Athabascan vs Immigrants from Afghanistan Unemployment Among Ages 35 to 44 years

COMPARE

Alaskan Athabascan
Race
Ancestry
AfghanAfricanAlaska NativeAlaskan AthabascanAlbanianAleutAlsatianAmericanApacheArabArapahoArgentineanArmenianAssyrian/Chaldean/SyriacAustralianAustrianBahamianBangladeshiBarbadianBasqueBelgianBelizeanBermudanBhutaneseBlackfeetBolivianBrazilianBritishBritish West IndianBulgarianBurmeseCajunCambodianCanadianCape VerdeanCarpatho RusynCelticCentral AmericanCentral American IndianCherokeeCheyenneChickasawChileanChineseChippewaChoctawColombianColvilleComancheCosta RicanCreeCreekCroatianCrowCubanCypriotCzechCzechoslovakianDanishDelawareDominicanDutchDutch West IndianEastern EuropeanEcuadorianEgyptianEnglishEstonianEthiopianEuropeanFijianFilipinoFinnishFrenchFrench American IndianFrench CanadianGermanGerman RussianGhanaianGreekGuamanian/ChamorroGuatemalanGuyaneseHaitianHmongHonduranHopiHoumaHungarianIcelanderIndian (Asian)IndonesianInupiatIranianIraqiIrishIroquoisIsraeliItalianJamaicanJapaneseJordanianKenyanKiowaKoreanLaotianLatvianLebaneseLiberianLithuanianLumbeeLuxembourgerMacedonianMalaysianMalteseMarshalleseMenomineeMexicanMexican American IndianMongolianMoroccanNative HawaiianNavajoNepaleseNew ZealanderNicaraguanNigerianNorthern EuropeanNorwegianOkinawanOsageOttawaPaiutePakistaniPalestinianPanamanianParaguayanPennsylvania GermanPeruvianPimaPolishPortuguesePotawatomiPuebloPuerto RicanPuget Sound SalishRomanianRussianSalvadoranSamoanScandinavianScotch-IrishScottishSeminoleSenegaleseSerbianShoshoneSierra LeoneanSiouxSlavicSlovakSloveneSomaliSouth AfricanSouth AmericanSouth American IndianSoviet UnionSpaniardSpanishSpanish AmericanSpanish American IndianSri LankanSubsaharan AfricanSudaneseSwedishSwissSyrianTaiwaneseThaiTlingit-HaidaTohono O'OdhamTonganTrinidadian and TobagonianTsimshianTurkishU.S. Virgin IslanderUgandanUkrainianUruguayanUteVenezuelanVietnameseWelshWest IndianYakamaYaquiYugoslavianYumanYup'ikZimbabwean
Immigration
NonimmigrantsImmigrantsAfricaAlbaniaArgentinaArmeniaAsiaAustraliaAustriaBahamasBangladeshBarbadosBelarusBelgiumBelizeBoliviaBosnia and HerzegovinaBrazilBulgariaBurma/MyanmarCabo VerdeCambodiaCameroonCanadaCaribbeanCentral AmericaChileChinaColombiaCongoCosta RicaCroatiaCubaCzechoslovakiaDenmarkDominicaDominican RepublicEastern AfricaEastern AsiaEastern EuropeEcuadorEgyptEl SalvadorEnglandEritreaEthiopiaEuropeFijiFranceGermanyGhanaGreeceGrenadaGuatemalaGuyanaHaitiHondurasHong KongHungaryIndiaIndonesiaIranIraqIrelandIsraelItalyJamaicaJapanJordanKazakhstanKenyaKoreaKuwaitLaosLatin AmericaLatviaLebanonLiberiaLithuaniaMalaysiaMexicoMicronesiaMiddle AfricaMoldovaMoroccoNepalNetherlandsNicaraguaNigeriaNorth AmericaNorth MacedoniaNorthern AfricaNorthern EuropeNorwayOceaniaPakistanPanamaPeruPhilippinesPolandPortugalRomaniaRussiaSaudi ArabiaScotlandSenegalSerbiaSierra LeoneSingaporeSomaliaSouth AfricaSouth AmericaSouth Central AsiaSouth Eastern AsiaSouthern EuropeSpainSri LankaSt. Vincent and the GrenadinesSudanSwedenSwitzerlandSyriaTaiwanThailandTrinidad and TobagoTurkeyUgandaUkraineUruguayUzbekistanVenezuelaVietnamWest IndiesWestern AfricaWestern AsiaWestern EuropeYemenZaireZimbabweAzores
Immigrants from Afghanistan
Race
Ancestry
AfghanAfricanAlaska NativeAlbanianAleutAlsatianAmericanApacheArabArapahoArgentineanArmenianAssyrian/Chaldean/SyriacAustralianAustrianBahamianBangladeshiBarbadianBasqueBelgianBelizeanBermudanBhutaneseBlackfeetBolivianBrazilianBritishBritish West IndianBulgarianBurmeseCajunCambodianCanadianCape VerdeanCarpatho RusynCelticCentral AmericanCentral American IndianCherokeeCheyenneChickasawChileanChineseChippewaChoctawColombianColvilleComancheCosta RicanCreeCreekCroatianCrowCubanCypriotCzechCzechoslovakianDanishDelawareDominicanDutchDutch West IndianEastern EuropeanEcuadorianEgyptianEnglishEstonianEthiopianEuropeanFijianFilipinoFinnishFrenchFrench American IndianFrench CanadianGermanGerman RussianGhanaianGreekGuamanian/ChamorroGuatemalanGuyaneseHaitianHmongHonduranHopiHoumaHungarianIcelanderIndian (Asian)IndonesianInupiatIranianIraqiIrishIroquoisIsraeliItalianJamaicanJapaneseJordanianKenyanKiowaKoreanLaotianLatvianLebaneseLiberianLithuanianLumbeeLuxembourgerMacedonianMalaysianMalteseMarshalleseMenomineeMexicanMexican American IndianMongolianMoroccanNative HawaiianNavajoNepaleseNew ZealanderNicaraguanNigerianNorthern EuropeanNorwegianOkinawanOsageOttawaPaiutePakistaniPalestinianPanamanianParaguayanPennsylvania GermanPeruvianPimaPolishPortuguesePotawatomiPuebloPuerto RicanPuget Sound SalishRomanianRussianSalvadoranSamoanScandinavianScotch-IrishScottishSeminoleSenegaleseSerbianShoshoneSierra LeoneanSiouxSlavicSlovakSloveneSomaliSouth AfricanSouth AmericanSouth American IndianSoviet UnionSpaniardSpanishSpanish AmericanSpanish American IndianSri LankanSubsaharan AfricanSudaneseSwedishSwissSyrianTaiwaneseThaiTlingit-HaidaTohono O'OdhamTonganTrinidadian and TobagonianTsimshianTurkishU.S. Virgin IslanderUgandanUkrainianUruguayanUteVenezuelanVietnameseWelshWest IndianYakamaYaquiYugoslavianYumanYup'ikZimbabwean
Immigration
NonimmigrantsImmigrantsAfghanistanAfricaAlbaniaArgentinaArmeniaAsiaAustraliaAustriaBahamasBangladeshBarbadosBelarusBelgiumBelizeBoliviaBosnia and HerzegovinaBrazilBulgariaBurma/MyanmarCabo VerdeCambodiaCameroonCanadaCaribbeanCentral AmericaChileChinaColombiaCongoCosta RicaCroatiaCubaCzechoslovakiaDenmarkDominicaDominican RepublicEastern AfricaEastern AsiaEastern EuropeEcuadorEgyptEl SalvadorEnglandEritreaEthiopiaEuropeFijiFranceGermanyGhanaGreeceGrenadaGuatemalaGuyanaHaitiHondurasHong KongHungaryIndiaIndonesiaIranIraqIrelandIsraelItalyJamaicaJapanJordanKazakhstanKenyaKoreaKuwaitLaosLatin AmericaLatviaLebanonLiberiaLithuaniaMalaysiaMexicoMicronesiaMiddle AfricaMoldovaMoroccoNepalNetherlandsNicaraguaNigeriaNorth AmericaNorth MacedoniaNorthern AfricaNorthern EuropeNorwayOceaniaPakistanPanamaPeruPhilippinesPolandPortugalRomaniaRussiaSaudi ArabiaScotlandSenegalSerbiaSierra LeoneSingaporeSomaliaSouth AfricaSouth AmericaSouth Central AsiaSouth Eastern AsiaSouthern EuropeSpainSri LankaSt. Vincent and the GrenadinesSudanSwedenSwitzerlandSyriaTaiwanThailandTrinidad and TobagoTurkeyUgandaUkraineUruguayUzbekistanVenezuelaVietnamWest IndiesWestern AfricaWestern AsiaWestern EuropeYemenZaireZimbabweAzores
Unemployment Among Ages 35 to 44 years
Income
Poverty
Unemployment
Labor Participation
Family Structure
Vehicle Availability
Education Level
Disability

Unemployment Among Ages 35 to 44 years Comparison

Alaskan Athabascans

Immigrants from Afghanistan

Tragic
Fair
8.6%
UNEMPLOYMENT AMONG AGES 35 TO 44 YEARS
0.0/ 100
METRIC RATING
340th/ 347
METRIC RANK
4.8%
UNEMPLOYMENT AMONG AGES 35 TO 44 YEARS
20.2/ 100
METRIC RATING
202nd/ 347
METRIC RANK

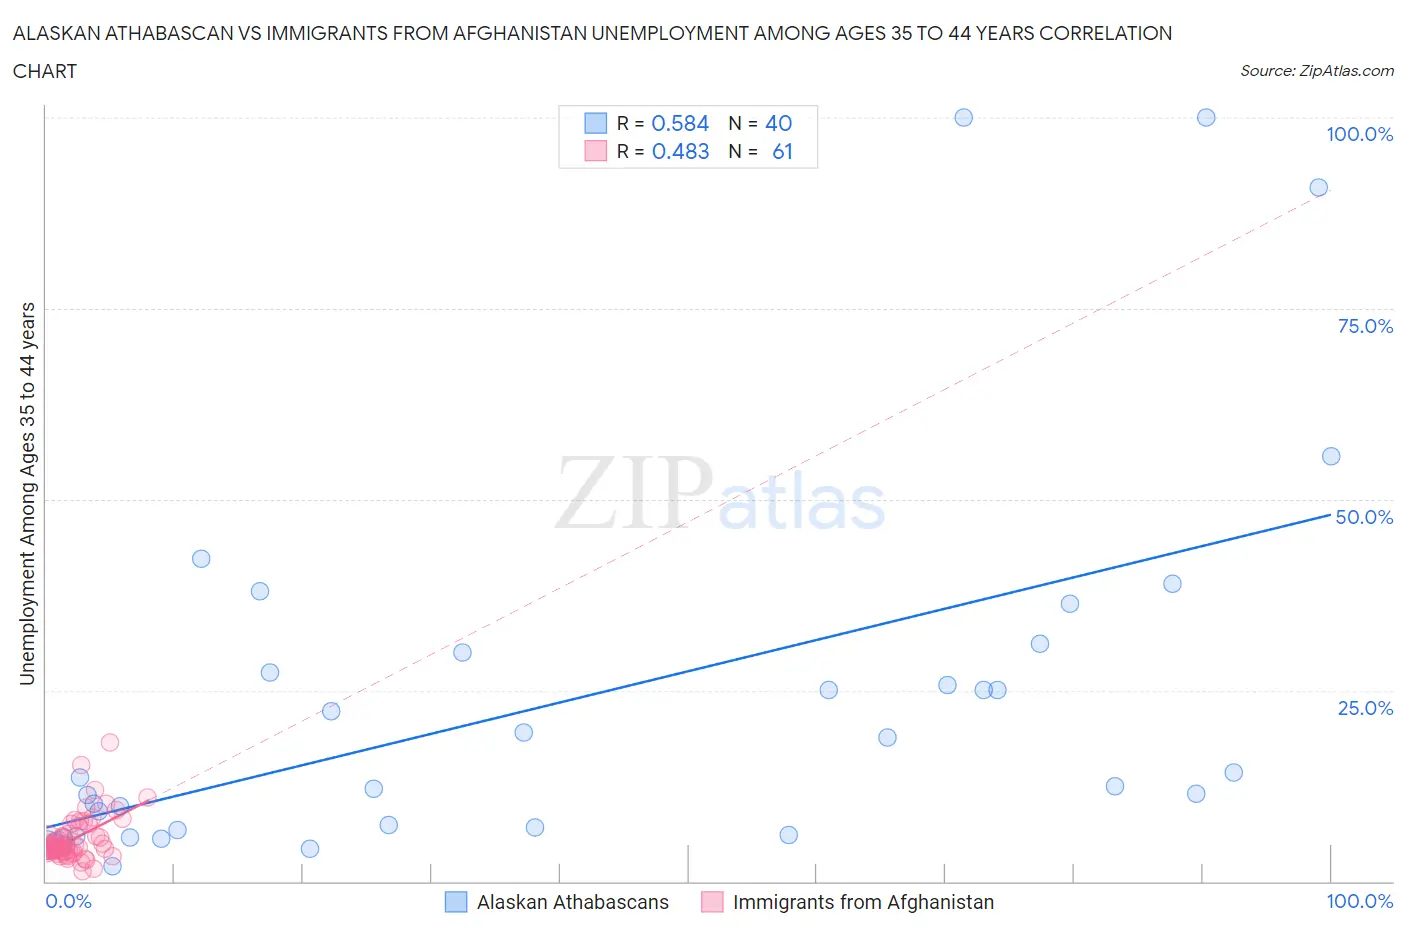
Alaskan Athabascan vs Immigrants from Afghanistan Unemployment Among Ages 35 to 44 years Correlation Chart

The statistical analysis conducted on geographies consisting of 45,477,715 people shows a substantial positive correlation between the proportion of Alaskan Athabascans and unemployment rate among population between the ages 35 and 44 in the United States with a correlation coefficient (R) of 0.584 and weighted average of 8.6%. Similarly, the statistical analysis conducted on geographies consisting of 146,927,179 people shows a moderate positive correlation between the proportion of Immigrants from Afghanistan and unemployment rate among population between the ages 35 and 44 in the United States with a correlation coefficient (R) of 0.483 and weighted average of 4.8%, a difference of 79.7%.
Alaskan Athabascan vs Immigrants from Afghanistan Unemployment Among Ages 35 to 44 years

Unemployment Among Ages 35 to 44 years Correlation Summary

MeasurementAlaskan AthabascanImmigrants from Afghanistan
Minimum2.0%1.4%
Maximum100.0%18.2%
Range98.0%16.8%
Mean23.2%5.6%
Median13.0%4.5%
Interquartile 25% (IQ1)6.4%3.9%
Interquartile 75% (IQ3)28.7%6.7%
Interquartile Range (IQR)22.4%2.8%
Standard Deviation (Sample)24.8%3.0%
Standard Deviation (Population)24.5%3.0%

Similar Demographics by Unemployment Among Ages 35 to 44 years

Demographics Similar to Alaskan Athabascans by Unemployment Among Ages 35 to 44 years

In terms of unemployment among ages 35 to 44 years, the demographic groups most similar to Alaskan Athabascans are Inupiat (8.6%, a difference of 0.69%), Cheyenne (8.5%, a difference of 1.8%), Tohono O'odham (8.4%, a difference of 2.3%), Apache (8.4%, a difference of 2.7%), and Hopi (8.9%, a difference of 2.9%).
DemographicsRating | RankUnemployment Among Ages 35 to 44 years
Puerto Ricans
0.0
/100
|
#333
Tragic
7.6%
Houma
0.0
/100
|
#334
Tragic
7.8%
Sioux
0.0
/100
|
#335
Tragic
8.4%
Apache
0.0
/100
|
#336
Tragic
8.4%
Tohono O'odham
0.0
/100
|
#337
Tragic
8.4%
Cheyenne
0.0
/100
|
#338
Tragic
8.5%
Inupiat
0.0
/100
|
#339
Tragic
8.6%
Alaskan Athabascans
0.0
/100
|
#340
Tragic
8.6%
Hopi
0.0
/100
|
#341
Tragic
8.9%
Navajo
0.0
/100
|
#342
Tragic
9.3%
Arapaho
0.0
/100
|
#343
Tragic
10.3%
Pima
0.0
/100
|
#344
Tragic
11.8%
Yup'ik
0.0
/100
|
#345
Tragic
14.4%
Crow
0.0
/100
|
#346
Tragic
15.7%
Yuman
0.0
/100
|
#347
Tragic
16.9%

Demographics Similar to Immigrants from Afghanistan by Unemployment Among Ages 35 to 44 years

In terms of unemployment among ages 35 to 44 years, the demographic groups most similar to Immigrants from Afghanistan are Uruguayan (4.8%, a difference of 0.020%), Immigrants from Philippines (4.8%, a difference of 0.040%), Ugandan (4.8%, a difference of 0.12%), Immigrants from Ukraine (4.8%, a difference of 0.13%), and Spaniard (4.8%, a difference of 0.17%).
DemographicsRating | RankUnemployment Among Ages 35 to 44 years
Bangladeshis
28.0
/100
|
#195
Fair
4.8%
Immigrants | Syria
23.6
/100
|
#196
Fair
4.8%
Immigrants | Oceania
23.2
/100
|
#197
Fair
4.8%
Immigrants | Thailand
22.9
/100
|
#198
Fair
4.8%
Immigrants | Middle Africa
21.9
/100
|
#199
Fair
4.8%
Immigrants | Ukraine
21.4
/100
|
#200
Fair
4.8%
Ugandans
21.4
/100
|
#201
Fair
4.8%
Immigrants | Afghanistan
20.2
/100
|
#202
Fair
4.8%
Uruguayans
20.0
/100
|
#203
Fair
4.8%
Immigrants | Philippines
19.8
/100
|
#204
Poor
4.8%
Spaniards
18.7
/100
|
#205
Poor
4.8%
Soviet Union
18.4
/100
|
#206
Poor
4.8%
Immigrants | Western Asia
16.6
/100
|
#207
Poor
4.8%
French Canadians
16.5
/100
|
#208
Poor
4.8%
Immigrants | Uruguay
11.5
/100
|
#209
Poor
4.9%