Alaska Native vs Immigrants from South America Unemployment
COMPARE
Alaska Native
Immigrants from South America
Unemployment
Unemployment Comparison
Alaska Natives
Immigrants from South America
7.2%
UNEMPLOYMENT
0.0/ 100
METRIC RATING
329th/ 347
METRIC RANK
5.4%
UNEMPLOYMENT
13.5/ 100
METRIC RATING
216th/ 347
METRIC RANK
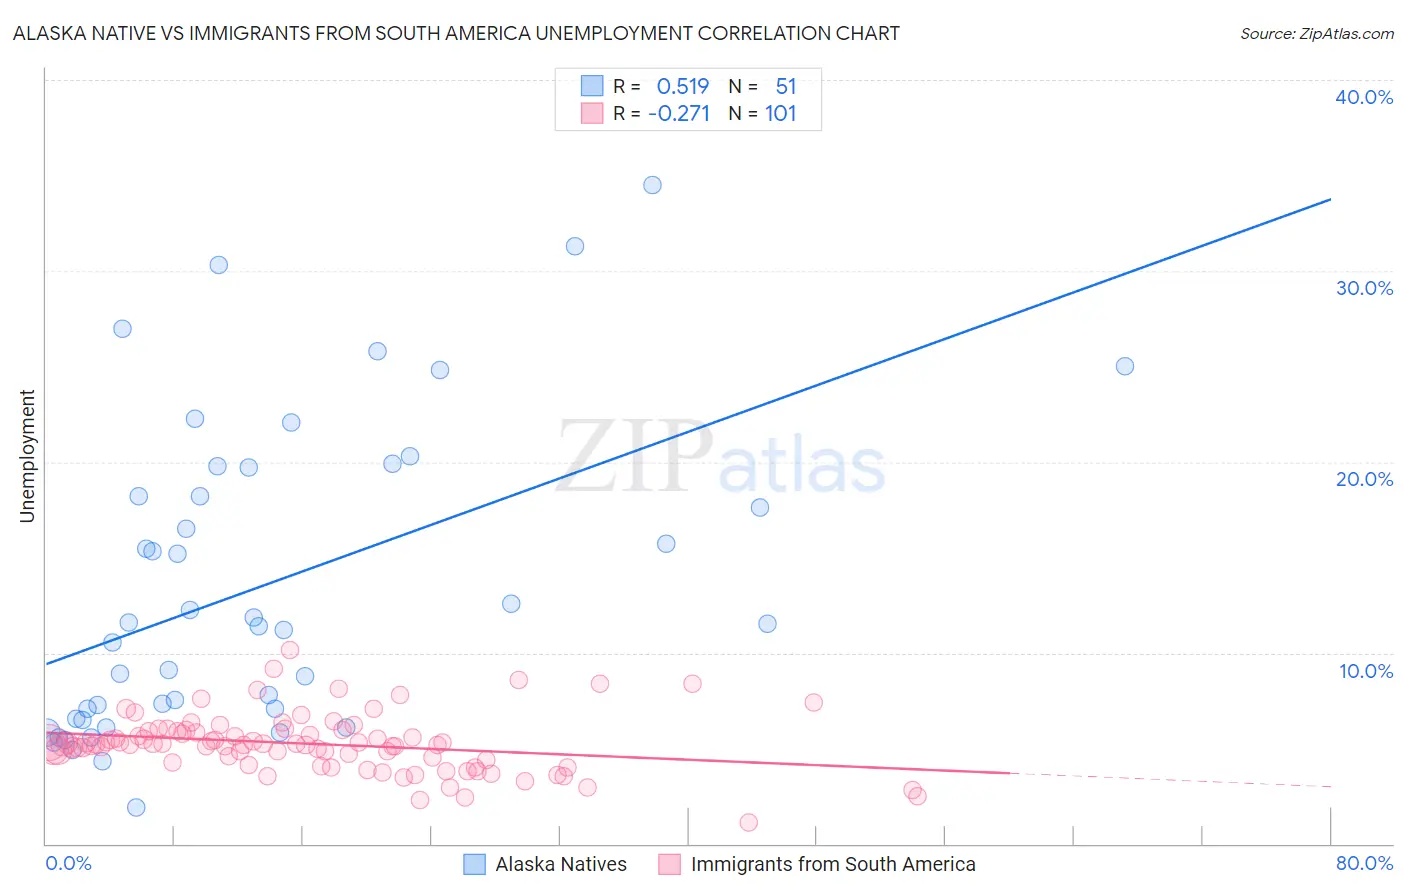
Alaska Native vs Immigrants from South America Unemployment Correlation Chart
The statistical analysis conducted on geographies consisting of 76,749,531 people shows a substantial positive correlation between the proportion of Alaska Natives and unemployment in the United States with a correlation coefficient (R) of 0.519 and weighted average of 7.2%. Similarly, the statistical analysis conducted on geographies consisting of 485,517,559 people shows a weak negative correlation between the proportion of Immigrants from South America and unemployment in the United States with a correlation coefficient (R) of -0.271 and weighted average of 5.4%, a difference of 33.9%.
Unemployment Correlation Summary
| Measurement | Alaska Native | Immigrants from South America |
| Minimum | 1.9% | 1.1% |
| Maximum | 34.5% | 10.1% |
| Range | 32.6% | 9.0% |
| Mean | 13.5% | 5.2% |
| Median | 11.5% | 5.2% |
| Interquartile 25% (IQ1) | 6.6% | 4.3% |
| Interquartile 75% (IQ3) | 19.7% | 5.9% |
| Interquartile Range (IQR) | 13.1% | 1.5% |
| Standard Deviation (Sample) | 8.0% | 1.5% |
| Standard Deviation (Population) | 8.0% | 1.5% |
Similar Demographics by Unemployment
Demographics Similar to Alaska Natives by Unemployment
In terms of unemployment, the demographic groups most similar to Alaska Natives are Tsimshian (7.2%, a difference of 0.31%), Pueblo (7.2%, a difference of 1.2%), Yakama (7.3%, a difference of 1.3%), Dominican (7.4%, a difference of 1.6%), and Paiute (7.1%, a difference of 1.8%).
| Demographics | Rating | Rank | Unemployment |
| Guyanese | 0.0 /100 | #322 | Tragic 6.9% |
| Immigrants | Grenada | 0.0 /100 | #323 | Tragic 6.9% |
| Immigrants | Armenia | 0.0 /100 | #324 | Tragic 7.0% |
| Natives/Alaskans | 0.0 /100 | #325 | Tragic 7.0% |
| Paiute | 0.0 /100 | #326 | Tragic 7.1% |
| Pueblo | 0.0 /100 | #327 | Tragic 7.2% |
| Tsimshian | 0.0 /100 | #328 | Tragic 7.2% |
| Alaska Natives | 0.0 /100 | #329 | Tragic 7.2% |
| Yakama | 0.0 /100 | #330 | Tragic 7.3% |
| Dominicans | 0.0 /100 | #331 | Tragic 7.4% |
| Sioux | 0.0 /100 | #332 | Tragic 7.4% |
| Immigrants | Dominican Republic | 0.0 /100 | #333 | Tragic 7.4% |
| Apache | 0.0 /100 | #334 | Tragic 7.4% |
| Alaskan Athabascans | 0.0 /100 | #335 | Tragic 7.7% |
| Immigrants | Yemen | 0.0 /100 | #336 | Tragic 7.7% |
Demographics Similar to Immigrants from South America by Unemployment
In terms of unemployment, the demographic groups most similar to Immigrants from South America are Immigrants from Albania (5.4%, a difference of 0.0%), Choctaw (5.4%, a difference of 0.10%), Delaware (5.4%, a difference of 0.16%), Immigrants from Middle Africa (5.4%, a difference of 0.22%), and Immigrants from Costa Rica (5.4%, a difference of 0.22%).
| Demographics | Rating | Rank | Unemployment |
| Immigrants | Iran | 18.8 /100 | #209 | Poor 5.4% |
| Immigrants | Iraq | 18.6 /100 | #210 | Poor 5.4% |
| Iraqis | 18.1 /100 | #211 | Poor 5.4% |
| Ugandans | 18.0 /100 | #212 | Poor 5.4% |
| Immigrants | Middle Africa | 15.3 /100 | #213 | Poor 5.4% |
| Immigrants | Costa Rica | 15.2 /100 | #214 | Poor 5.4% |
| Delaware | 14.7 /100 | #215 | Poor 5.4% |
| Immigrants | South America | 13.5 /100 | #216 | Poor 5.4% |
| Immigrants | Albania | 13.5 /100 | #217 | Poor 5.4% |
| Choctaw | 12.7 /100 | #218 | Poor 5.4% |
| Bangladeshis | 11.2 /100 | #219 | Poor 5.4% |
| Soviet Union | 10.6 /100 | #220 | Poor 5.4% |
| Immigrants | Philippines | 10.4 /100 | #221 | Poor 5.4% |
| Iroquois | 10.3 /100 | #222 | Poor 5.4% |
| Seminole | 9.2 /100 | #223 | Tragic 5.4% |