Zip Codes with the Highest Percentage of Population Employed in Arts, Media & Entertainment in Henderson, TX
RELATED REPORTS & OPTIONS
Arts, Media & Entertainment
Henderson
Compare Zip Codes
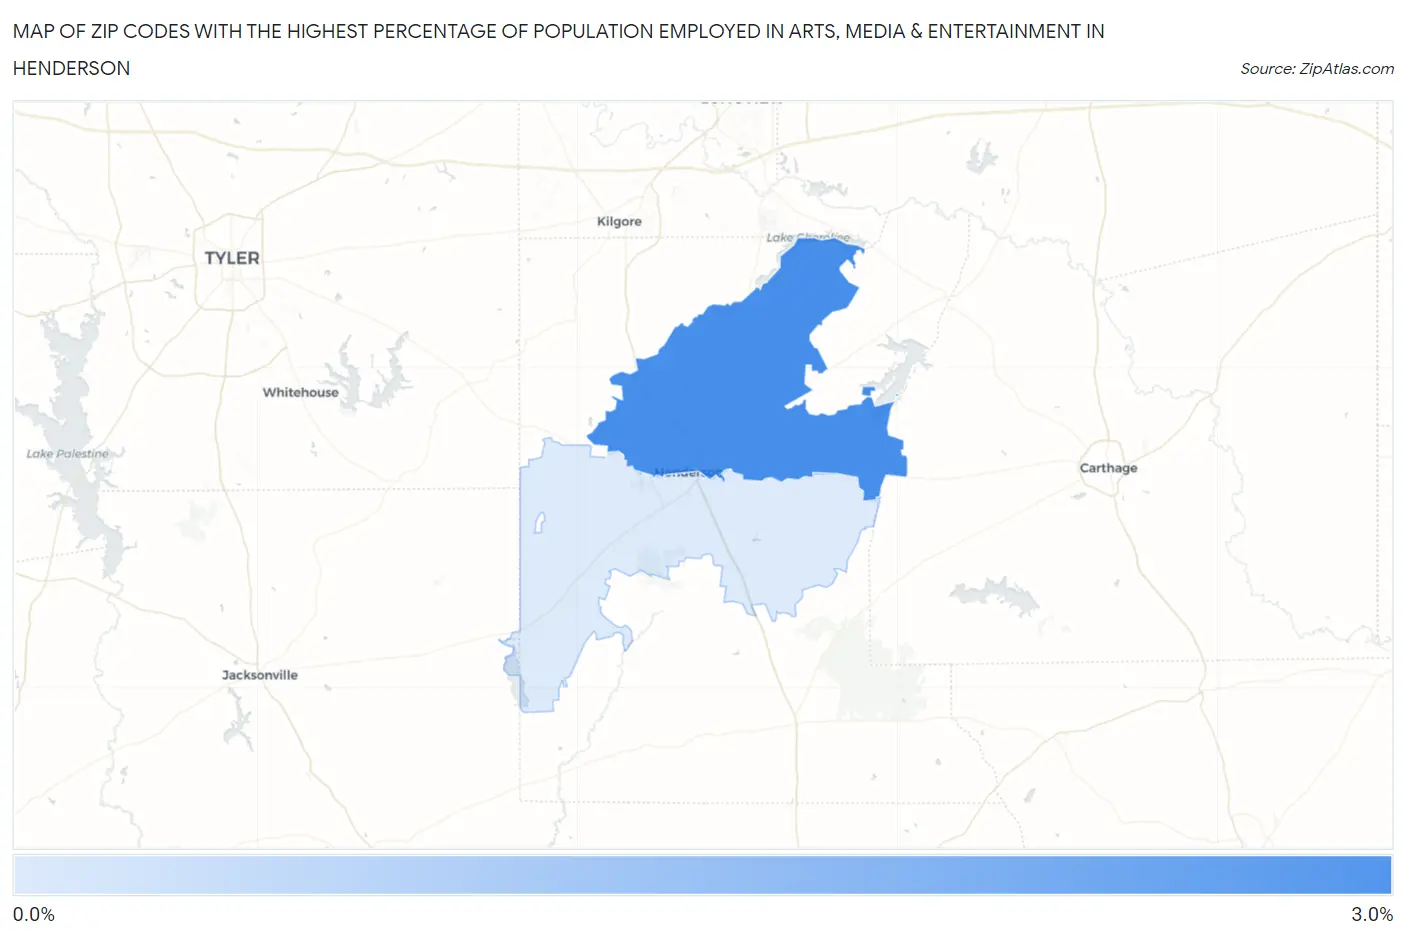
Map of Zip Codes with the Highest Percentage of Population Employed in Arts, Media & Entertainment in Henderson
0.0%
3.0%
Zip Codes with the Highest Percentage of Population Employed in Arts, Media & Entertainment in Henderson, TX
| Zip Code | % Employed | vs State | vs National | |
| 1. | 75652 | 2.8% | 1.7%(+1.10)#189 | 2.1%(+0.696)#4,735 |
| 2. | 75654 | 0.61% | 1.7%(-1.05)#1,014 | 2.1%(-1.46)#18,014 |
1
Common Questions
What are the Top Zip Codes with the Highest Percentage of Population Employed in Arts, Media & Entertainment in Henderson, TX?
Top Zip Codes with the Highest Percentage of Population Employed in Arts, Media & Entertainment in Henderson, TX are:
What zip code has the Highest Percentage of Population Employed in Arts, Media & Entertainment in Henderson, TX?
75652 has the Highest Percentage of Population Employed in Arts, Media & Entertainment in Henderson, TX with 2.8%.
What is the Percentage of Population Employed in Arts, Media & Entertainment in Henderson, TX?
Percentage of Population Employed in Arts, Media & Entertainment in Henderson is 1.1%.
What is the Percentage of Population Employed in Arts, Media & Entertainment in Texas?
Percentage of Population Employed in Arts, Media & Entertainment in Texas is 1.7%.
What is the Percentage of Population Employed in Arts, Media & Entertainment in the United States?
Percentage of Population Employed in Arts, Media & Entertainment in the United States is 2.1%.