Zip Codes with the Highest Percentage of Population Employed in Computer & Mathematics in Spearfish, SD
RELATED REPORTS & OPTIONS
Computer & Mathematics
Spearfish
Compare Zip Codes
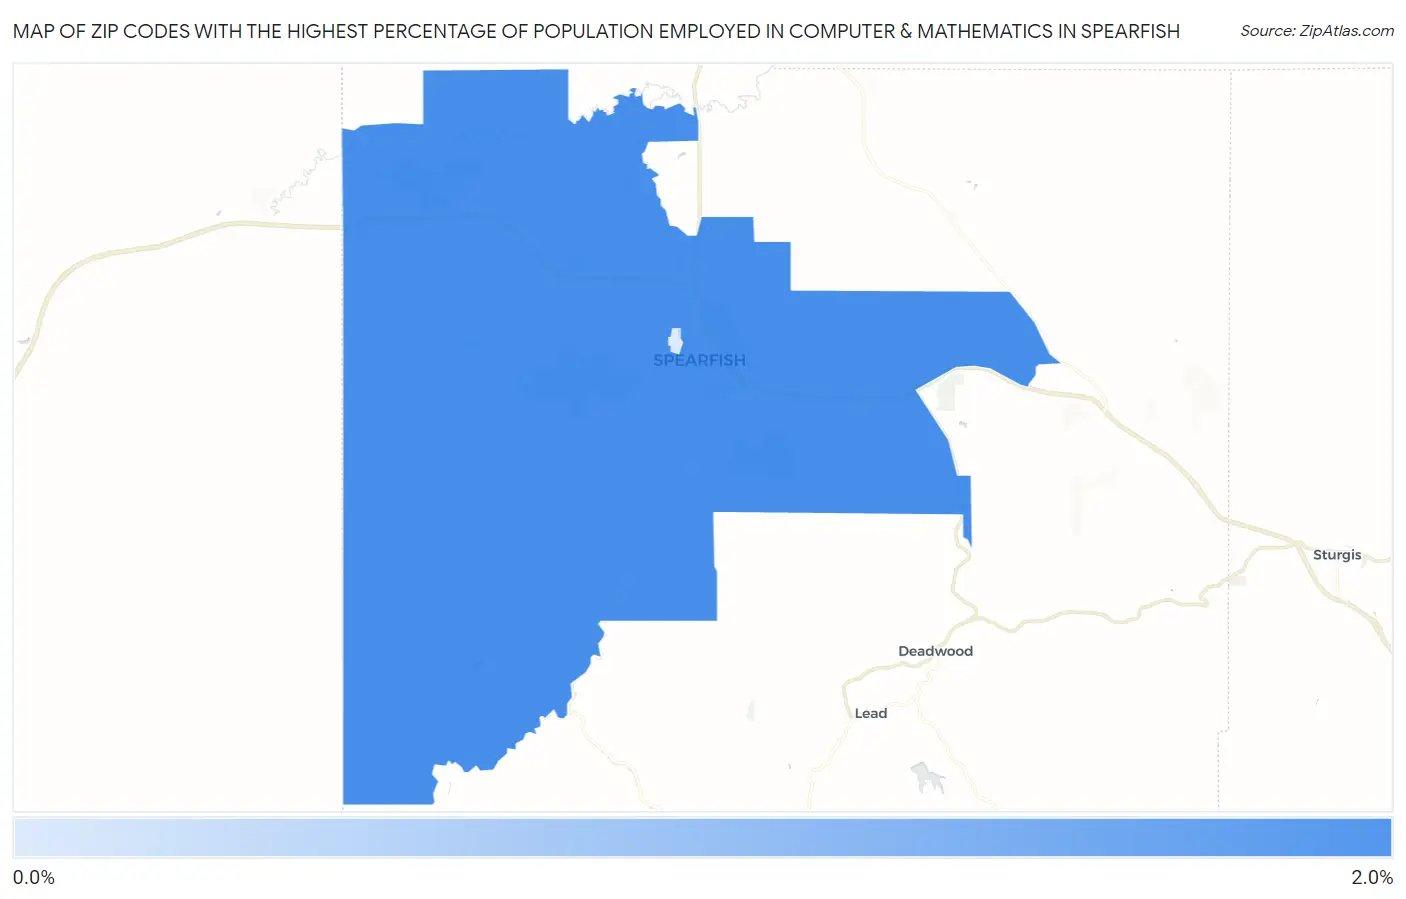
Map of Zip Codes with the Highest Percentage of Population Employed in Computer & Mathematics in Spearfish
0.0%
2.0%
Zip Codes with the Highest Percentage of Population Employed in Computer & Mathematics in Spearfish, SD
| Zip Code | % Employed | vs State | vs National | |
| 1. | 57783 | 1.8% | 2.0%(-0.247)#69 | 3.5%(-1.76)#12,896 |
| 2. | 57799 | 0.97% | 2.0%(-1.04)#123 | 3.5%(-2.55)#17,555 |
1
Common Questions
What are the Top Zip Codes with the Highest Percentage of Population Employed in Computer & Mathematics in Spearfish, SD?
Top Zip Codes with the Highest Percentage of Population Employed in Computer & Mathematics in Spearfish, SD are:
What zip code has the Highest Percentage of Population Employed in Computer & Mathematics in Spearfish, SD?
57783 has the Highest Percentage of Population Employed in Computer & Mathematics in Spearfish, SD with 1.8%.
What is the Percentage of Population Employed in Computer & Mathematics in Spearfish, SD?
Percentage of Population Employed in Computer & Mathematics in Spearfish is 2.0%.
What is the Percentage of Population Employed in Computer & Mathematics in South Dakota?
Percentage of Population Employed in Computer & Mathematics in South Dakota is 2.0%.
What is the Percentage of Population Employed in Computer & Mathematics in the United States?
Percentage of Population Employed in Computer & Mathematics in the United States is 3.5%.