Zimbabwean vs Osage Family Poverty
COMPARE
Zimbabwean
Osage
Family Poverty
Family Poverty Comparison
Zimbabweans
Osage
7.8%
FAMILY POVERTY
98.4/ 100
METRIC RATING
63rd/ 347
METRIC RANK
9.7%
FAMILY POVERTY
8.0/ 100
METRIC RATING
213th/ 347
METRIC RANK
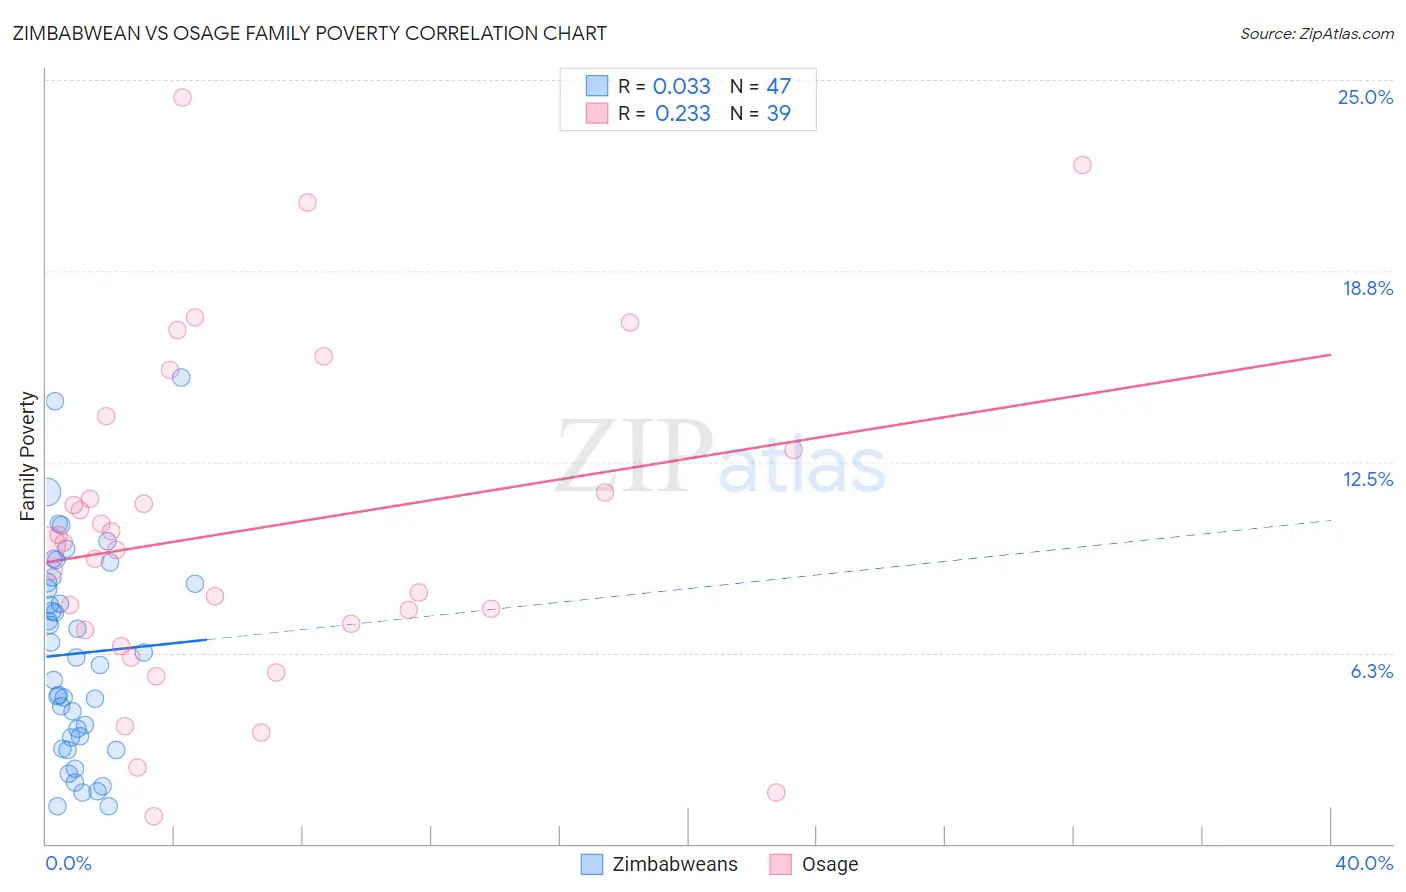
Zimbabwean vs Osage Family Poverty Correlation Chart
The statistical analysis conducted on geographies consisting of 69,162,841 people shows no correlation between the proportion of Zimbabweans and poverty level among families in the United States with a correlation coefficient (R) of 0.033 and weighted average of 7.8%. Similarly, the statistical analysis conducted on geographies consisting of 91,772,722 people shows a weak positive correlation between the proportion of Osage and poverty level among families in the United States with a correlation coefficient (R) of 0.233 and weighted average of 9.7%, a difference of 24.7%.
Family Poverty Correlation Summary
| Measurement | Zimbabwean | Osage |
| Minimum | 1.2% | 0.88% |
| Maximum | 15.3% | 24.4% |
| Range | 14.0% | 23.6% |
| Mean | 6.2% | 10.3% |
| Median | 6.1% | 9.8% |
| Interquartile 25% (IQ1) | 3.5% | 7.0% |
| Interquartile 75% (IQ3) | 8.6% | 12.9% |
| Interquartile Range (IQR) | 5.1% | 5.9% |
| Standard Deviation (Sample) | 3.4% | 5.4% |
| Standard Deviation (Population) | 3.4% | 5.4% |
Similar Demographics by Family Poverty
Demographics Similar to Zimbabweans by Family Poverty
In terms of family poverty, the demographic groups most similar to Zimbabweans are Korean (7.8%, a difference of 0.15%), Immigrants from Bulgaria (7.8%, a difference of 0.16%), Dutch (7.8%, a difference of 0.22%), Northern European (7.8%, a difference of 0.23%), and Australian (7.8%, a difference of 0.27%).
| Demographics | Rating | Rank | Family Poverty |
| Immigrants | Serbia | 98.7 /100 | #56 | Exceptional 7.7% |
| Asians | 98.7 /100 | #57 | Exceptional 7.7% |
| Finns | 98.7 /100 | #58 | Exceptional 7.7% |
| Europeans | 98.7 /100 | #59 | Exceptional 7.7% |
| Immigrants | Greece | 98.7 /100 | #60 | Exceptional 7.7% |
| Immigrants | Netherlands | 98.6 /100 | #61 | Exceptional 7.7% |
| Macedonians | 98.6 /100 | #62 | Exceptional 7.8% |
| Zimbabweans | 98.4 /100 | #63 | Exceptional 7.8% |
| Koreans | 98.3 /100 | #64 | Exceptional 7.8% |
| Immigrants | Bulgaria | 98.3 /100 | #65 | Exceptional 7.8% |
| Dutch | 98.3 /100 | #66 | Exceptional 7.8% |
| Northern Europeans | 98.3 /100 | #67 | Exceptional 7.8% |
| Australians | 98.2 /100 | #68 | Exceptional 7.8% |
| Immigrants | Belgium | 98.2 /100 | #69 | Exceptional 7.8% |
| Immigrants | Canada | 98.2 /100 | #70 | Exceptional 7.8% |
Demographics Similar to Osage by Family Poverty
In terms of family poverty, the demographic groups most similar to Osage are Immigrants from Micronesia (9.8%, a difference of 0.58%), Nonimmigrants (9.8%, a difference of 0.61%), Immigrants from Thailand (9.7%, a difference of 0.63%), Moroccan (9.8%, a difference of 0.67%), and American (9.8%, a difference of 0.87%).
| Demographics | Rating | Rank | Family Poverty |
| Immigrants | South America | 18.0 /100 | #206 | Poor 9.5% |
| Sierra Leoneans | 15.6 /100 | #207 | Poor 9.5% |
| Immigrants | Eastern Africa | 15.1 /100 | #208 | Poor 9.5% |
| Immigrants | Uruguay | 14.0 /100 | #209 | Poor 9.5% |
| Alsatians | 11.3 /100 | #210 | Poor 9.6% |
| Malaysians | 10.6 /100 | #211 | Poor 9.6% |
| Immigrants | Thailand | 9.7 /100 | #212 | Tragic 9.7% |
| Osage | 8.0 /100 | #213 | Tragic 9.7% |
| Immigrants | Micronesia | 6.7 /100 | #214 | Tragic 9.8% |
| Immigrants | Nonimmigrants | 6.7 /100 | #215 | Tragic 9.8% |
| Moroccans | 6.5 /100 | #216 | Tragic 9.8% |
| Americans | 6.2 /100 | #217 | Tragic 9.8% |
| Panamanians | 5.6 /100 | #218 | Tragic 9.8% |
| Immigrants | Eritrea | 5.4 /100 | #219 | Tragic 9.9% |
| Bermudans | 5.3 /100 | #220 | Tragic 9.9% |