Zimbabwean vs Immigrants from Sierra Leone Female Poverty
COMPARE
Zimbabwean
Immigrants from Sierra Leone
Female Poverty
Female Poverty Comparison
Zimbabweans
Immigrants from Sierra Leone
12.3%
FEMALE POVERTY
97.5/ 100
METRIC RATING
73rd/ 347
METRIC RANK
13.5%
FEMALE POVERTY
43.2/ 100
METRIC RATING
184th/ 347
METRIC RANK
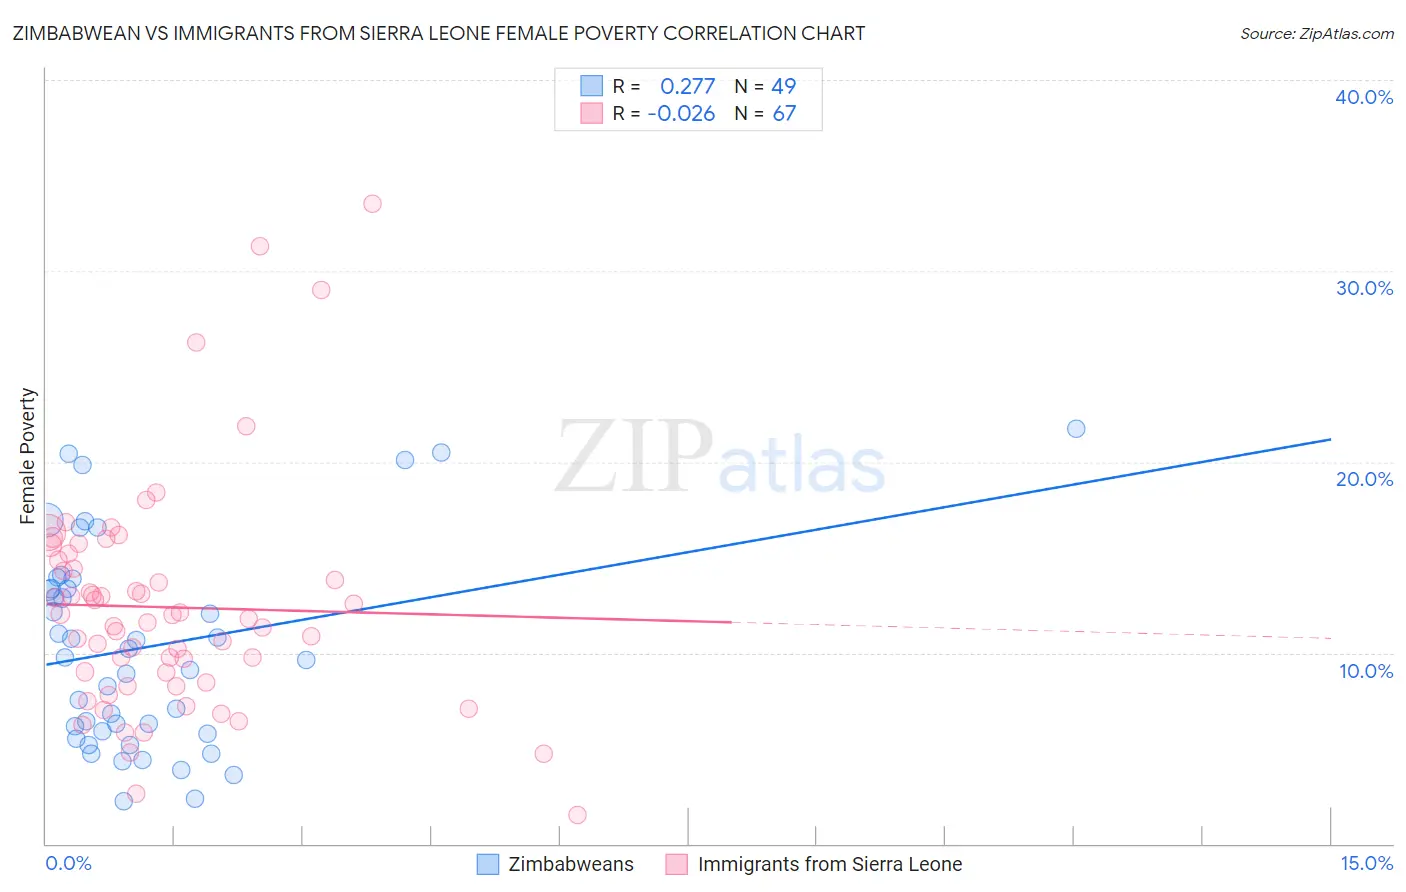
Zimbabwean vs Immigrants from Sierra Leone Female Poverty Correlation Chart
The statistical analysis conducted on geographies consisting of 69,185,827 people shows a weak positive correlation between the proportion of Zimbabweans and poverty level among females in the United States with a correlation coefficient (R) of 0.277 and weighted average of 12.3%. Similarly, the statistical analysis conducted on geographies consisting of 101,642,339 people shows no correlation between the proportion of Immigrants from Sierra Leone and poverty level among females in the United States with a correlation coefficient (R) of -0.026 and weighted average of 13.5%, a difference of 10.4%.
Female Poverty Correlation Summary
| Measurement | Zimbabwean | Immigrants from Sierra Leone |
| Minimum | 2.2% | 1.5% |
| Maximum | 21.7% | 33.5% |
| Range | 19.5% | 32.0% |
| Mean | 10.3% | 12.4% |
| Median | 9.7% | 11.8% |
| Interquartile 25% (IQ1) | 5.8% | 8.4% |
| Interquartile 75% (IQ3) | 13.6% | 14.9% |
| Interquartile Range (IQR) | 7.8% | 6.4% |
| Standard Deviation (Sample) | 5.3% | 6.0% |
| Standard Deviation (Population) | 5.2% | 5.9% |
Similar Demographics by Female Poverty
Demographics Similar to Zimbabweans by Female Poverty
In terms of female poverty, the demographic groups most similar to Zimbabweans are Immigrants from Canada (12.3%, a difference of 0.010%), Cambodian (12.2%, a difference of 0.020%), Carpatho Rusyn (12.2%, a difference of 0.050%), European (12.3%, a difference of 0.13%), and Immigrants from Belgium (12.2%, a difference of 0.18%).
| Demographics | Rating | Rank | Female Poverty |
| Austrians | 97.9 /100 | #66 | Exceptional 12.2% |
| Immigrants | Eastern Asia | 97.8 /100 | #67 | Exceptional 12.2% |
| Immigrants | Netherlands | 97.8 /100 | #68 | Exceptional 12.2% |
| Swiss | 97.7 /100 | #69 | Exceptional 12.2% |
| Immigrants | Belgium | 97.7 /100 | #70 | Exceptional 12.2% |
| Carpatho Rusyns | 97.6 /100 | #71 | Exceptional 12.2% |
| Cambodians | 97.5 /100 | #72 | Exceptional 12.2% |
| Zimbabweans | 97.5 /100 | #73 | Exceptional 12.3% |
| Immigrants | Canada | 97.5 /100 | #74 | Exceptional 12.3% |
| Europeans | 97.4 /100 | #75 | Exceptional 12.3% |
| Immigrants | Eastern Europe | 97.2 /100 | #76 | Exceptional 12.3% |
| Serbians | 97.2 /100 | #77 | Exceptional 12.3% |
| Egyptians | 97.2 /100 | #78 | Exceptional 12.3% |
| Immigrants | North America | 97.1 /100 | #79 | Exceptional 12.3% |
| Slovaks | 97.1 /100 | #80 | Exceptional 12.3% |
Demographics Similar to Immigrants from Sierra Leone by Female Poverty
In terms of female poverty, the demographic groups most similar to Immigrants from Sierra Leone are Kenyan (13.5%, a difference of 0.060%), Immigrants from Cameroon (13.5%, a difference of 0.11%), Venezuelan (13.5%, a difference of 0.13%), Immigrants from Colombia (13.5%, a difference of 0.13%), and South American (13.5%, a difference of 0.16%).
| Demographics | Rating | Rank | Female Poverty |
| Immigrants | Morocco | 49.4 /100 | #177 | Average 13.4% |
| Israelis | 49.1 /100 | #178 | Average 13.5% |
| Immigrants | Syria | 48.8 /100 | #179 | Average 13.5% |
| South Americans | 44.8 /100 | #180 | Average 13.5% |
| Venezuelans | 44.5 /100 | #181 | Average 13.5% |
| Immigrants | Colombia | 44.5 /100 | #182 | Average 13.5% |
| Kenyans | 43.8 /100 | #183 | Average 13.5% |
| Immigrants | Sierra Leone | 43.2 /100 | #184 | Average 13.5% |
| Immigrants | Cameroon | 42.0 /100 | #185 | Average 13.5% |
| Immigrants | Portugal | 41.5 /100 | #186 | Average 13.6% |
| Immigrants | Venezuela | 41.0 /100 | #187 | Average 13.6% |
| Hawaiians | 39.9 /100 | #188 | Fair 13.6% |
| Uruguayans | 39.8 /100 | #189 | Fair 13.6% |
| Sierra Leoneans | 33.1 /100 | #190 | Fair 13.7% |
| Immigrants | Kuwait | 32.7 /100 | #191 | Fair 13.7% |