Yup'ik vs Immigrants from Latin America Single Female Poverty
COMPARE
Yup'ik
Immigrants from Latin America
Single Female Poverty
Single Female Poverty Comparison
Yup'ik
Immigrants from Latin America
26.6%
SINGLE FEMALE POVERTY
0.0/ 100
METRIC RATING
321st/ 347
METRIC RANK
23.7%
SINGLE FEMALE POVERTY
0.0/ 100
METRIC RATING
280th/ 347
METRIC RANK
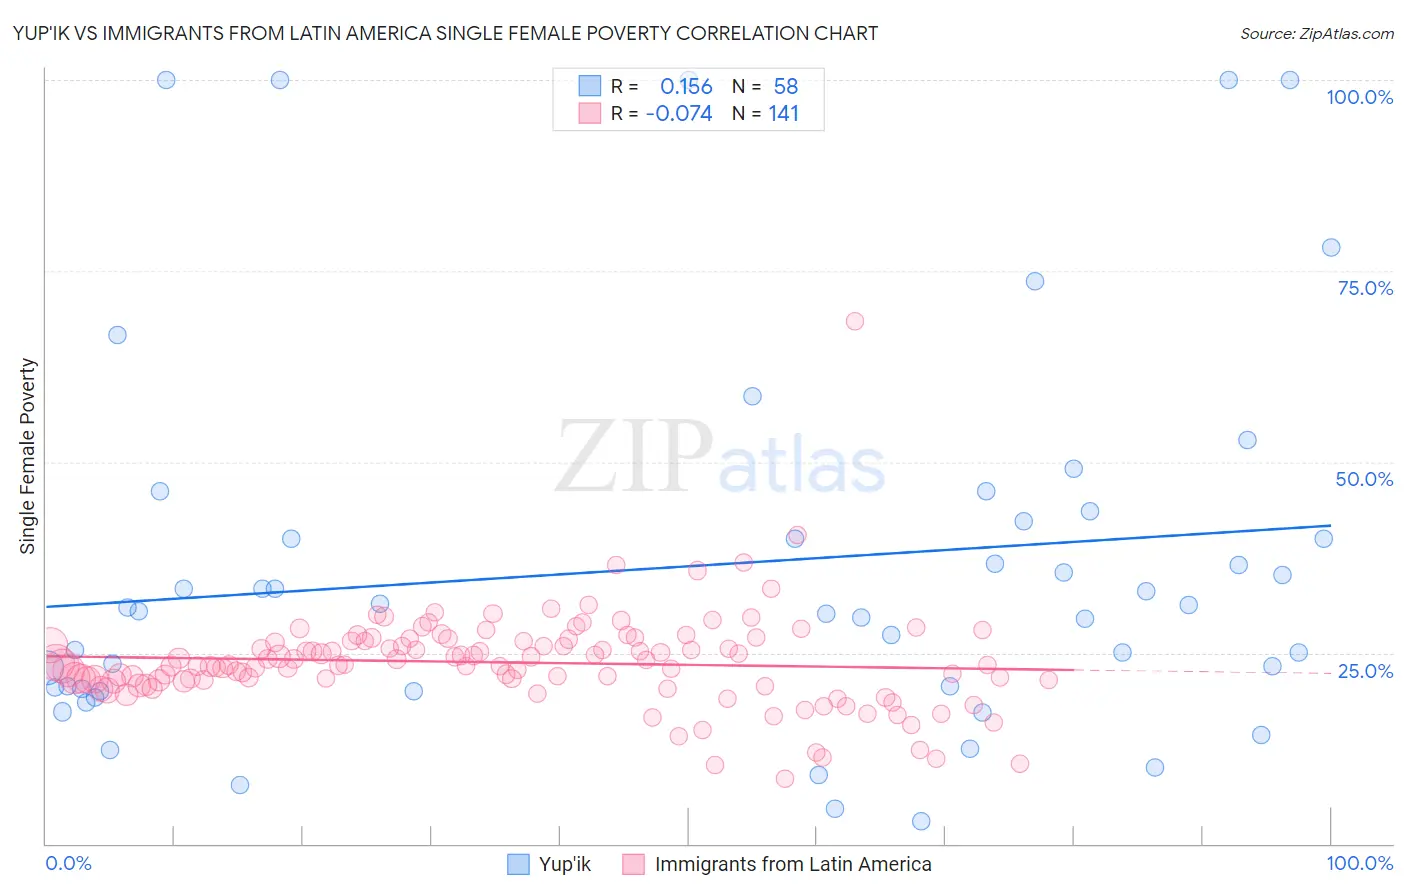
Yup'ik vs Immigrants from Latin America Single Female Poverty Correlation Chart
The statistical analysis conducted on geographies consisting of 39,804,505 people shows a poor positive correlation between the proportion of Yup'ik and poverty level among single females in the United States with a correlation coefficient (R) of 0.156 and weighted average of 26.6%. Similarly, the statistical analysis conducted on geographies consisting of 541,789,164 people shows a slight negative correlation between the proportion of Immigrants from Latin America and poverty level among single females in the United States with a correlation coefficient (R) of -0.074 and weighted average of 23.7%, a difference of 12.2%.
Single Female Poverty Correlation Summary
| Measurement | Yup'ik | Immigrants from Latin America |
| Minimum | 2.9% | 8.5% |
| Maximum | 100.0% | 68.5% |
| Range | 97.1% | 60.0% |
| Mean | 36.3% | 23.7% |
| Median | 30.7% | 23.4% |
| Interquartile 25% (IQ1) | 20.3% | 21.3% |
| Interquartile 75% (IQ3) | 42.3% | 26.5% |
| Interquartile Range (IQR) | 22.0% | 5.2% |
| Standard Deviation (Sample) | 25.0% | 6.4% |
| Standard Deviation (Population) | 24.8% | 6.4% |
Similar Demographics by Single Female Poverty
Demographics Similar to Yup'ik by Single Female Poverty
In terms of single female poverty, the demographic groups most similar to Yup'ik are Arapaho (26.4%, a difference of 0.64%), Seminole (26.8%, a difference of 0.74%), Chippewa (26.8%, a difference of 0.84%), Black/African American (26.4%, a difference of 0.95%), and Kiowa (26.9%, a difference of 1.3%).
| Demographics | Rating | Rank | Single Female Poverty |
| Cherokee | 0.0 /100 | #314 | Tragic 25.7% |
| Iroquois | 0.0 /100 | #315 | Tragic 25.7% |
| Immigrants | Somalia | 0.0 /100 | #316 | Tragic 25.8% |
| Ottawa | 0.0 /100 | #317 | Tragic 26.0% |
| Chickasaw | 0.0 /100 | #318 | Tragic 26.3% |
| Blacks/African Americans | 0.0 /100 | #319 | Tragic 26.4% |
| Arapaho | 0.0 /100 | #320 | Tragic 26.4% |
| Yup'ik | 0.0 /100 | #321 | Tragic 26.6% |
| Seminole | 0.0 /100 | #322 | Tragic 26.8% |
| Chippewa | 0.0 /100 | #323 | Tragic 26.8% |
| Kiowa | 0.0 /100 | #324 | Tragic 26.9% |
| Choctaw | 0.0 /100 | #325 | Tragic 27.2% |
| Creek | 0.0 /100 | #326 | Tragic 27.4% |
| Dutch West Indians | 0.0 /100 | #327 | Tragic 27.5% |
| Apache | 0.0 /100 | #328 | Tragic 27.7% |
Demographics Similar to Immigrants from Latin America by Single Female Poverty
In terms of single female poverty, the demographic groups most similar to Immigrants from Latin America are Alaskan Athabascan (23.6%, a difference of 0.49%), Immigrants from Zaire (23.8%, a difference of 0.51%), Nonimmigrants (23.6%, a difference of 0.53%), Guatemalan (23.8%, a difference of 0.56%), and Pennsylvania German (23.6%, a difference of 0.60%).
| Demographics | Rating | Rank | Single Female Poverty |
| Alaska Natives | 0.1 /100 | #273 | Tragic 23.3% |
| Marshallese | 0.1 /100 | #274 | Tragic 23.3% |
| Mexican American Indians | 0.1 /100 | #275 | Tragic 23.4% |
| Immigrants | Azores | 0.0 /100 | #276 | Tragic 23.5% |
| Pennsylvania Germans | 0.0 /100 | #277 | Tragic 23.6% |
| Immigrants | Nonimmigrants | 0.0 /100 | #278 | Tragic 23.6% |
| Alaskan Athabascans | 0.0 /100 | #279 | Tragic 23.6% |
| Immigrants | Latin America | 0.0 /100 | #280 | Tragic 23.7% |
| Immigrants | Zaire | 0.0 /100 | #281 | Tragic 23.8% |
| Guatemalans | 0.0 /100 | #282 | Tragic 23.8% |
| German Russians | 0.0 /100 | #283 | Tragic 23.9% |
| Immigrants | Dominica | 0.0 /100 | #284 | Tragic 23.9% |
| Immigrants | Guatemala | 0.0 /100 | #285 | Tragic 24.1% |
| Cree | 0.0 /100 | #286 | Tragic 24.1% |
| Bangladeshis | 0.0 /100 | #287 | Tragic 24.2% |