Yugoslavian vs Ugandan Single Male Poverty
COMPARE
Yugoslavian
Ugandan
Single Male Poverty
Single Male Poverty Comparison
Yugoslavians
Ugandans
12.6%
SINGLE MALE POVERTY
73.9/ 100
METRIC RATING
148th/ 347
METRIC RANK
12.3%
SINGLE MALE POVERTY
94.5/ 100
METRIC RATING
109th/ 347
METRIC RANK
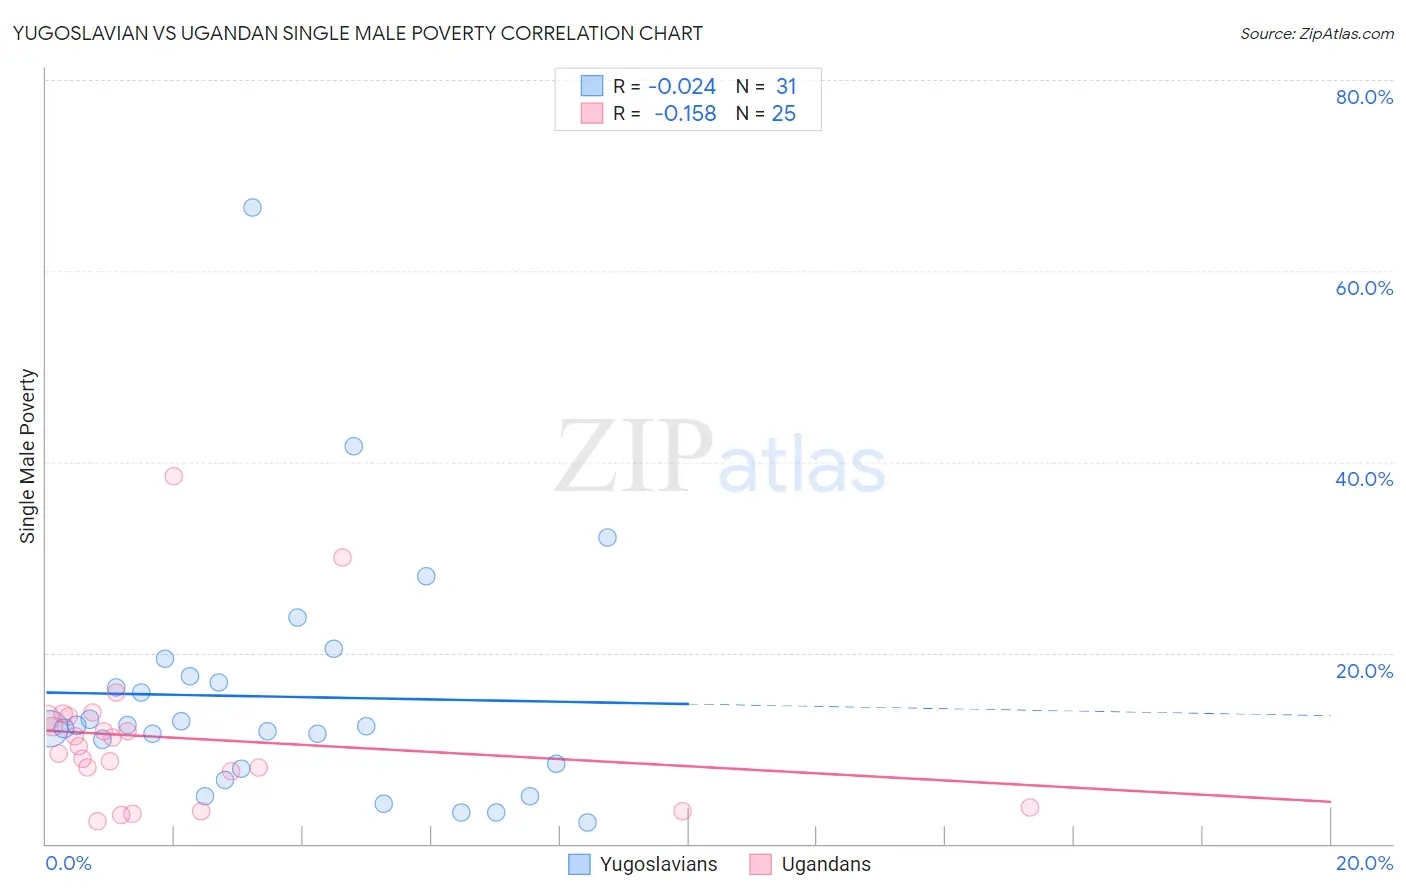
Yugoslavian vs Ugandan Single Male Poverty Correlation Chart
The statistical analysis conducted on geographies consisting of 258,600,754 people shows no correlation between the proportion of Yugoslavians and poverty level among single males in the United States with a correlation coefficient (R) of -0.024 and weighted average of 12.6%. Similarly, the statistical analysis conducted on geographies consisting of 90,762,990 people shows a poor negative correlation between the proportion of Ugandans and poverty level among single males in the United States with a correlation coefficient (R) of -0.158 and weighted average of 12.3%, a difference of 2.5%.
Single Male Poverty Correlation Summary
| Measurement | Yugoslavian | Ugandan |
| Minimum | 2.3% | 2.3% |
| Maximum | 66.7% | 38.5% |
| Range | 64.4% | 36.1% |
| Mean | 15.4% | 11.1% |
| Median | 12.3% | 10.2% |
| Interquartile 25% (IQ1) | 7.9% | 5.7% |
| Interquartile 75% (IQ3) | 17.6% | 13.3% |
| Interquartile Range (IQR) | 9.7% | 7.5% |
| Standard Deviation (Sample) | 12.9% | 8.1% |
| Standard Deviation (Population) | 12.7% | 7.9% |
Similar Demographics by Single Male Poverty
Demographics Similar to Yugoslavians by Single Male Poverty
In terms of single male poverty, the demographic groups most similar to Yugoslavians are Malaysian (12.6%, a difference of 0.060%), Immigrants from Lebanon (12.6%, a difference of 0.070%), Native Hawaiian (12.6%, a difference of 0.070%), Sierra Leonean (12.6%, a difference of 0.070%), and Hawaiian (12.6%, a difference of 0.080%).
| Demographics | Rating | Rank | Single Male Poverty |
| Okinawans | 75.9 /100 | #141 | Good 12.6% |
| Immigrants | Uganda | 75.9 /100 | #142 | Good 12.6% |
| Immigrants | France | 75.8 /100 | #143 | Good 12.6% |
| Hawaiians | 75.1 /100 | #144 | Good 12.6% |
| Immigrants | Lebanon | 75.0 /100 | #145 | Good 12.6% |
| Native Hawaiians | 75.0 /100 | #146 | Good 12.6% |
| Malaysians | 74.8 /100 | #147 | Good 12.6% |
| Yugoslavians | 73.9 /100 | #148 | Good 12.6% |
| Sierra Leoneans | 73.0 /100 | #149 | Good 12.6% |
| Immigrants | Panama | 72.1 /100 | #150 | Good 12.6% |
| Immigrants | Hungary | 71.9 /100 | #151 | Good 12.6% |
| Australians | 71.4 /100 | #152 | Good 12.6% |
| Immigrants | Immigrants | 70.1 /100 | #153 | Good 12.7% |
| Immigrants | Scotland | 68.9 /100 | #154 | Good 12.7% |
| Immigrants | Spain | 68.7 /100 | #155 | Good 12.7% |
Demographics Similar to Ugandans by Single Male Poverty
In terms of single male poverty, the demographic groups most similar to Ugandans are Immigrants from Eastern Africa (12.3%, a difference of 0.13%), Iraqi (12.3%, a difference of 0.15%), Immigrants from Portugal (12.3%, a difference of 0.23%), Immigrants from North Macedonia (12.3%, a difference of 0.24%), and Kenyan (12.4%, a difference of 0.30%).
| Demographics | Rating | Rank | Single Male Poverty |
| Immigrants | Europe | 97.0 /100 | #102 | Exceptional 12.2% |
| Immigrants | Armenia | 96.7 /100 | #103 | Exceptional 12.2% |
| Immigrants | Kazakhstan | 96.7 /100 | #104 | Exceptional 12.2% |
| Jordanians | 95.9 /100 | #105 | Exceptional 12.3% |
| Immigrants | Morocco | 95.6 /100 | #106 | Exceptional 12.3% |
| Iraqis | 95.1 /100 | #107 | Exceptional 12.3% |
| Immigrants | Eastern Africa | 95.0 /100 | #108 | Exceptional 12.3% |
| Ugandans | 94.5 /100 | #109 | Exceptional 12.3% |
| Immigrants | Portugal | 93.6 /100 | #110 | Exceptional 12.3% |
| Immigrants | North Macedonia | 93.6 /100 | #111 | Exceptional 12.3% |
| Kenyans | 93.3 /100 | #112 | Exceptional 12.4% |
| Pakistanis | 92.4 /100 | #113 | Exceptional 12.4% |
| Nicaraguans | 92.1 /100 | #114 | Exceptional 12.4% |
| Immigrants | Southern Europe | 91.5 /100 | #115 | Exceptional 12.4% |
| Immigrants | Syria | 91.2 /100 | #116 | Exceptional 12.4% |