Yaqui vs Argentinean Single Father Poverty
COMPARE
Yaqui
Argentinean
Single Father Poverty
Single Father Poverty Comparison
Yaqui
Argentineans
15.6%
SINGLE FATHER POVERTY
98.1/ 100
METRIC RATING
97th/ 347
METRIC RANK
15.8%
SINGLE FATHER POVERTY
94.4/ 100
METRIC RATING
114th/ 347
METRIC RANK
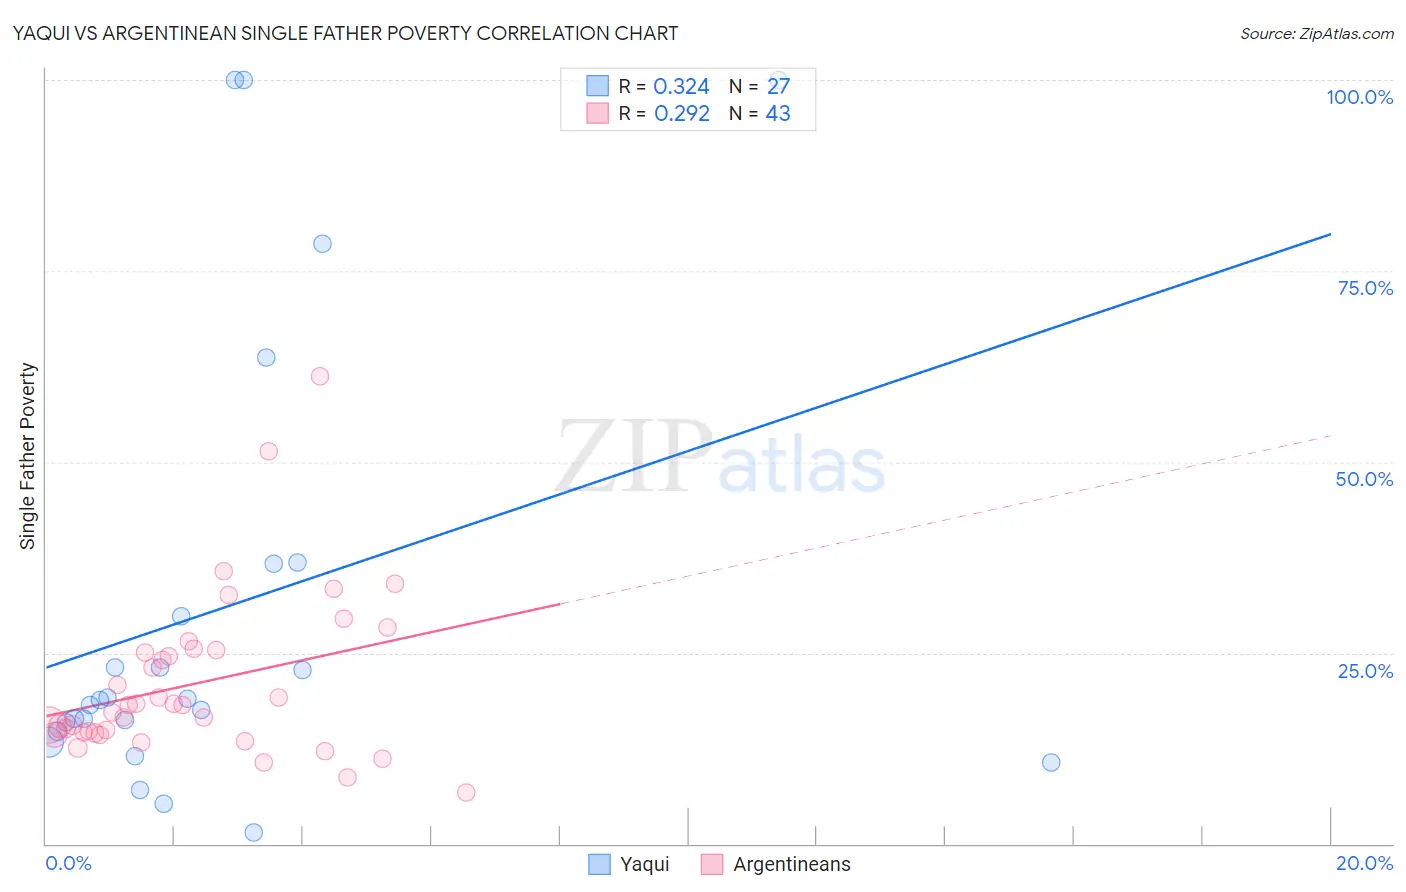
Yaqui vs Argentinean Single Father Poverty Correlation Chart
The statistical analysis conducted on geographies consisting of 98,465,633 people shows a mild positive correlation between the proportion of Yaqui and poverty level among single fathers in the United States with a correlation coefficient (R) of 0.324 and weighted average of 15.6%. Similarly, the statistical analysis conducted on geographies consisting of 241,909,455 people shows a weak positive correlation between the proportion of Argentineans and poverty level among single fathers in the United States with a correlation coefficient (R) of 0.292 and weighted average of 15.8%, a difference of 1.3%.
Single Father Poverty Correlation Summary
| Measurement | Yaqui | Argentinean |
| Minimum | 1.4% | 6.7% |
| Maximum | 100.0% | 61.3% |
| Range | 98.6% | 54.6% |
| Mean | 30.9% | 20.9% |
| Median | 18.8% | 18.2% |
| Interquartile 25% (IQ1) | 14.8% | 14.5% |
| Interquartile 75% (IQ3) | 36.7% | 25.3% |
| Interquartile Range (IQR) | 22.0% | 10.8% |
| Standard Deviation (Sample) | 29.8% | 10.6% |
| Standard Deviation (Population) | 29.2% | 10.5% |
Demographics Similar to Yaqui and Argentineans by Single Father Poverty
In terms of single father poverty, the demographic groups most similar to Yaqui are Immigrants from Belgium (15.6%, a difference of 0.010%), Zimbabwean (15.6%, a difference of 0.010%), Immigrants from Kazakhstan (15.6%, a difference of 0.020%), Immigrants from Middle Africa (15.6%, a difference of 0.37%), and Immigrants from Chile (15.7%, a difference of 0.59%). Similarly, the demographic groups most similar to Argentineans are Danish (15.8%, a difference of 0.020%), Immigrants from Latvia (15.8%, a difference of 0.060%), Bulgarian (15.8%, a difference of 0.090%), Immigrants from Africa (15.8%, a difference of 0.14%), and Turkish (15.8%, a difference of 0.15%).
| Demographics | Rating | Rank | Single Father Poverty |
| Immigrants | Kazakhstan | 98.2 /100 | #95 | Exceptional 15.6% |
| Immigrants | Belgium | 98.1 /100 | #96 | Exceptional 15.6% |
| Yaqui | 98.1 /100 | #97 | Exceptional 15.6% |
| Zimbabweans | 98.1 /100 | #98 | Exceptional 15.6% |
| Immigrants | Middle Africa | 97.4 /100 | #99 | Exceptional 15.6% |
| Immigrants | Chile | 96.9 /100 | #100 | Exceptional 15.7% |
| Fijians | 96.8 /100 | #101 | Exceptional 15.7% |
| Chileans | 96.4 /100 | #102 | Exceptional 15.7% |
| South American Indians | 96.2 /100 | #103 | Exceptional 15.7% |
| Australians | 96.1 /100 | #104 | Exceptional 15.7% |
| Immigrants | Australia | 96.1 /100 | #105 | Exceptional 15.7% |
| Immigrants | Poland | 95.8 /100 | #106 | Exceptional 15.7% |
| Native Hawaiians | 95.8 /100 | #107 | Exceptional 15.7% |
| Pakistanis | 95.7 /100 | #108 | Exceptional 15.7% |
| Turks | 95.1 /100 | #109 | Exceptional 15.8% |
| Immigrants | Africa | 95.1 /100 | #110 | Exceptional 15.8% |
| Bulgarians | 94.8 /100 | #111 | Exceptional 15.8% |
| Immigrants | Latvia | 94.7 /100 | #112 | Exceptional 15.8% |
| Danes | 94.5 /100 | #113 | Exceptional 15.8% |
| Argentineans | 94.4 /100 | #114 | Exceptional 15.8% |
| Immigrants | Thailand | 93.6 /100 | #115 | Exceptional 15.8% |