Yakama vs Immigrants from Ireland Female Poverty Among 25-34 Year Olds

COMPARE

Yakama
Race
Ancestry
AfghanAfricanAlaska NativeAlaskan AthabascanAlbanianAleutAlsatianAmericanApacheArabArapahoArgentineanArmenianAssyrian/Chaldean/SyriacAustralianAustrianBahamianBangladeshiBarbadianBasqueBelgianBelizeanBermudanBhutaneseBlackfeetBolivianBrazilianBritishBritish West IndianBulgarianBurmeseCajunCambodianCanadianCape VerdeanCarpatho RusynCelticCentral AmericanCentral American IndianCherokeeCheyenneChickasawChileanChineseChippewaChoctawColombianColvilleComancheCosta RicanCreeCreekCroatianCrowCubanCypriotCzechCzechoslovakianDanishDelawareDominicanDutchDutch West IndianEastern EuropeanEcuadorianEgyptianEnglishEstonianEthiopianEuropeanFijianFilipinoFinnishFrenchFrench American IndianFrench CanadianGermanGerman RussianGhanaianGreekGuamanian/ChamorroGuatemalanGuyaneseHaitianHmongHonduranHopiHoumaHungarianIcelanderIndian (Asian)IndonesianInupiatIranianIraqiIrishIroquoisIsraeliItalianJamaicanJapaneseJordanianKenyanKiowaKoreanLaotianLatvianLebaneseLiberianLithuanianLumbeeLuxembourgerMacedonianMalaysianMalteseMarshalleseMenomineeMexicanMexican American IndianMongolianMoroccanNative HawaiianNavajoNepaleseNew ZealanderNicaraguanNigerianNorthern EuropeanNorwegianOkinawanOsageOttawaPaiutePakistaniPalestinianPanamanianParaguayanPennsylvania GermanPeruvianPimaPolishPortuguesePotawatomiPuebloPuerto RicanPuget Sound SalishRomanianRussianSalvadoranSamoanScandinavianScotch-IrishScottishSeminoleSenegaleseSerbianShoshoneSierra LeoneanSiouxSlavicSlovakSloveneSomaliSouth AfricanSouth AmericanSouth American IndianSoviet UnionSpaniardSpanishSpanish AmericanSpanish American IndianSri LankanSubsaharan AfricanSudaneseSwedishSwissSyrianTaiwaneseThaiTlingit-HaidaTohono O'OdhamTonganTrinidadian and TobagonianTsimshianTurkishU.S. Virgin IslanderUgandanUkrainianUruguayanUteVenezuelanVietnameseWelshWest IndianYakamaYaquiYugoslavianYumanYup'ikZimbabwean
Immigration
NonimmigrantsImmigrantsAfghanistanAfricaAlbaniaArgentinaArmeniaAsiaAustraliaAustriaBahamasBangladeshBarbadosBelarusBelgiumBelizeBoliviaBosnia and HerzegovinaBrazilBulgariaBurma/MyanmarCabo VerdeCambodiaCameroonCanadaCaribbeanCentral AmericaChileChinaColombiaCongoCosta RicaCroatiaCubaCzechoslovakiaDenmarkDominicaDominican RepublicEastern AfricaEastern AsiaEastern EuropeEcuadorEgyptEl SalvadorEnglandEritreaEthiopiaEuropeFijiFranceGermanyGhanaGreeceGrenadaGuatemalaGuyanaHaitiHondurasHong KongHungaryIndiaIndonesiaIranIraqIsraelItalyJamaicaJapanJordanKazakhstanKenyaKoreaKuwaitLaosLatin AmericaLatviaLebanonLiberiaLithuaniaMalaysiaMexicoMicronesiaMiddle AfricaMoldovaMoroccoNepalNetherlandsNicaraguaNigeriaNorth AmericaNorth MacedoniaNorthern AfricaNorthern EuropeNorwayOceaniaPakistanPanamaPeruPhilippinesPolandPortugalRomaniaRussiaSaudi ArabiaScotlandSenegalSerbiaSierra LeoneSingaporeSomaliaSouth AfricaSouth AmericaSouth Central AsiaSouth Eastern AsiaSouthern EuropeSpainSri LankaSt. Vincent and the GrenadinesSudanSwedenSwitzerlandSyriaTaiwanThailandTrinidad and TobagoTurkeyUgandaUkraineUruguayUzbekistanVenezuelaVietnamWest IndiesWestern AfricaWestern AsiaWestern EuropeYemenZaireZimbabweAzores
Immigrants from Ireland
Race
Ancestry
AfghanAfricanAlaska NativeAlaskan AthabascanAlbanianAleutAlsatianAmericanApacheArabArapahoArgentineanArmenianAssyrian/Chaldean/SyriacAustralianAustrianBahamianBangladeshiBarbadianBasqueBelgianBelizeanBermudanBhutaneseBlackfeetBolivianBrazilianBritishBritish West IndianBulgarianBurmeseCajunCambodianCanadianCape VerdeanCarpatho RusynCelticCentral AmericanCentral American IndianCherokeeCheyenneChickasawChileanChineseChippewaChoctawColombianColvilleComancheCosta RicanCreeCreekCroatianCrowCubanCypriotCzechCzechoslovakianDanishDelawareDominicanDutchDutch West IndianEastern EuropeanEcuadorianEgyptianEnglishEstonianEthiopianEuropeanFijianFilipinoFinnishFrenchFrench American IndianFrench CanadianGermanGerman RussianGhanaianGreekGuamanian/ChamorroGuatemalanGuyaneseHaitianHmongHonduranHopiHoumaHungarianIcelanderIndian (Asian)IndonesianInupiatIranianIraqiIrishIroquoisIsraeliItalianJamaicanJapaneseJordanianKenyanKiowaKoreanLaotianLatvianLebaneseLiberianLithuanianLumbeeLuxembourgerMacedonianMalaysianMalteseMarshalleseMenomineeMexicanMexican American IndianMongolianMoroccanNative HawaiianNavajoNepaleseNew ZealanderNicaraguanNigerianNorthern EuropeanNorwegianOkinawanOsageOttawaPaiutePakistaniPalestinianPanamanianParaguayanPennsylvania GermanPeruvianPimaPolishPortuguesePotawatomiPuebloPuerto RicanPuget Sound SalishRomanianRussianSalvadoranSamoanScandinavianScotch-IrishScottishSeminoleSenegaleseSerbianShoshoneSierra LeoneanSiouxSlavicSlovakSloveneSomaliSouth AfricanSouth AmericanSouth American IndianSoviet UnionSpaniardSpanishSpanish AmericanSpanish American IndianSri LankanSubsaharan AfricanSudaneseSwedishSwissSyrianTaiwaneseThaiTlingit-HaidaTohono O'OdhamTonganTrinidadian and TobagonianTsimshianTurkishU.S. Virgin IslanderUgandanUkrainianUruguayanUteVenezuelanVietnameseWelshWest IndianYaquiYugoslavianYumanYup'ikZimbabwean
Immigration
NonimmigrantsImmigrantsAfghanistanAfricaAlbaniaArgentinaArmeniaAsiaAustraliaAustriaBahamasBangladeshBarbadosBelarusBelgiumBelizeBoliviaBosnia and HerzegovinaBrazilBulgariaBurma/MyanmarCabo VerdeCambodiaCameroonCanadaCaribbeanCentral AmericaChileChinaColombiaCongoCosta RicaCroatiaCubaCzechoslovakiaDenmarkDominicaDominican RepublicEastern AfricaEastern AsiaEastern EuropeEcuadorEgyptEl SalvadorEnglandEritreaEthiopiaEuropeFijiFranceGermanyGhanaGreeceGrenadaGuatemalaGuyanaHaitiHondurasHong KongHungaryIndiaIndonesiaIranIraqIrelandIsraelItalyJamaicaJapanJordanKazakhstanKenyaKoreaKuwaitLaosLatin AmericaLatviaLebanonLiberiaLithuaniaMalaysiaMexicoMicronesiaMiddle AfricaMoldovaMoroccoNepalNetherlandsNicaraguaNigeriaNorth AmericaNorth MacedoniaNorthern AfricaNorthern EuropeNorwayOceaniaPakistanPanamaPeruPhilippinesPolandPortugalRomaniaRussiaSaudi ArabiaScotlandSenegalSerbiaSierra LeoneSingaporeSomaliaSouth AfricaSouth AmericaSouth Central AsiaSouth Eastern AsiaSouthern EuropeSpainSri LankaSt. Vincent and the GrenadinesSudanSwedenSwitzerlandSyriaTaiwanThailandTrinidad and TobagoTurkeyUgandaUkraineUruguayUzbekistanVenezuelaVietnamWest IndiesWestern AfricaWestern AsiaWestern EuropeYemenZaireZimbabweAzores
Female Poverty Among 25-34 Year Olds
Income
Poverty
Unemployment
Labor Participation
Family Structure
Vehicle Availability
Education Level
Disability

Female Poverty Among 25-34 Year Olds Comparison

Yakama

Immigrants from Ireland

Tragic
Exceptional
17.6%
FEMALE POVERTY AMONG 25-34 YEAR OLDS
0.0/ 100
METRIC RATING
315th/ 347
METRIC RANK
11.2%
FEMALE POVERTY AMONG 25-34 YEAR OLDS
100.0/ 100
METRIC RATING
12th/ 347
METRIC RANK

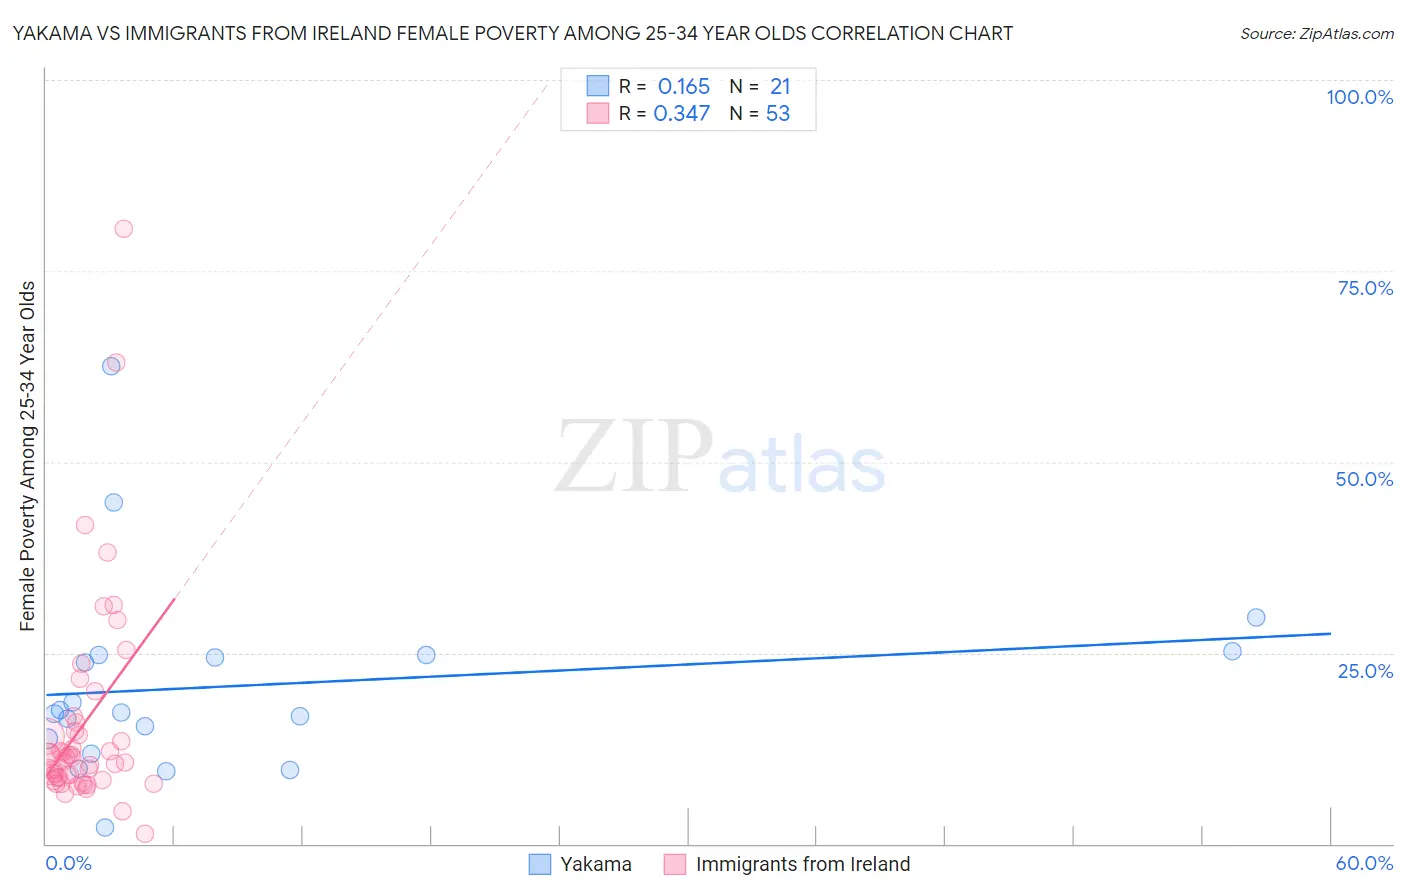
Yakama vs Immigrants from Ireland Female Poverty Among 25-34 Year Olds Correlation Chart

The statistical analysis conducted on geographies consisting of 19,834,857 people shows a poor positive correlation between the proportion of Yakama and poverty level among females between the ages 25 and 34 in the United States with a correlation coefficient (R) of 0.165 and weighted average of 17.6%. Similarly, the statistical analysis conducted on geographies consisting of 237,059,494 people shows a mild positive correlation between the proportion of Immigrants from Ireland and poverty level among females between the ages 25 and 34 in the United States with a correlation coefficient (R) of 0.347 and weighted average of 11.2%, a difference of 57.9%.
Yakama vs Immigrants from Ireland Female Poverty Among 25-34 Year Olds

Female Poverty Among 25-34 Year Olds Correlation Summary

MeasurementYakamaImmigrants from Ireland
Minimum2.1%1.4%
Maximum62.5%80.5%
Range60.4%79.1%
Mean20.7%15.6%
Median17.2%11.3%
Interquartile 25% (IQ1)12.8%8.5%
Interquartile 75% (IQ3)24.7%15.4%
Interquartile Range (IQR)12.0%6.9%
Standard Deviation (Sample)13.1%14.0%
Standard Deviation (Population)12.8%13.9%

Similar Demographics by Female Poverty Among 25-34 Year Olds

Demographics Similar to Yakama by Female Poverty Among 25-34 Year Olds

In terms of female poverty among 25-34 year olds, the demographic groups most similar to Yakama are Dominican (17.6%, a difference of 0.0%), Immigrants from Dominican Republic (17.6%, a difference of 0.22%), Arapaho (17.8%, a difference of 0.79%), Colville (17.5%, a difference of 0.90%), and Iroquois (17.5%, a difference of 0.98%).
DemographicsRating | RankFemale Poverty Among 25-34 Year Olds
Africans
0.0
/100
|
#308
Tragic
17.0%
Ottawa
0.0
/100
|
#309
Tragic
17.1%
Cherokee
0.0
/100
|
#310
Tragic
17.2%
Immigrants | Honduras
0.0
/100
|
#311
Tragic
17.3%
Iroquois
0.0
/100
|
#312
Tragic
17.5%
Colville
0.0
/100
|
#313
Tragic
17.5%
Immigrants | Dominican Republic
0.0
/100
|
#314
Tragic
17.6%
Yakama
0.0
/100
|
#315
Tragic
17.6%
Dominicans
0.0
/100
|
#316
Tragic
17.6%
Arapaho
0.0
/100
|
#317
Tragic
17.8%
Ute
0.0
/100
|
#318
Tragic
17.9%
Menominee
0.0
/100
|
#319
Tragic
18.0%
Chippewa
0.0
/100
|
#320
Tragic
18.0%
Choctaw
0.0
/100
|
#321
Tragic
18.1%
Central American Indians
0.0
/100
|
#322
Tragic
18.2%

Demographics Similar to Immigrants from Ireland by Female Poverty Among 25-34 Year Olds

In terms of female poverty among 25-34 year olds, the demographic groups most similar to Immigrants from Ireland are Burmese (11.2%, a difference of 0.11%), Indian (Asian) (11.2%, a difference of 0.11%), Immigrants from Korea (11.1%, a difference of 0.13%), Assyrian/Chaldean/Syriac (11.2%, a difference of 0.22%), and Immigrants from Bolivia (11.2%, a difference of 0.26%).
DemographicsRating | RankFemale Poverty Among 25-34 Year Olds
Immigrants | Hong Kong
100.0
/100
|
#5
Exceptional
10.4%
Immigrants | South Central Asia
100.0
/100
|
#6
Exceptional
10.8%
Chinese
100.0
/100
|
#7
Exceptional
11.0%
Immigrants | Iran
100.0
/100
|
#8
Exceptional
11.0%
Immigrants | Singapore
100.0
/100
|
#9
Exceptional
11.1%
Immigrants | Lithuania
100.0
/100
|
#10
Exceptional
11.1%
Immigrants | Korea
100.0
/100
|
#11
Exceptional
11.1%
Immigrants | Ireland
100.0
/100
|
#12
Exceptional
11.2%
Burmese
100.0
/100
|
#13
Exceptional
11.2%
Indians (Asian)
100.0
/100
|
#14
Exceptional
11.2%
Assyrians/Chaldeans/Syriacs
100.0
/100
|
#15
Exceptional
11.2%
Immigrants | Bolivia
100.0
/100
|
#16
Exceptional
11.2%
Immigrants | China
100.0
/100
|
#17
Exceptional
11.2%
Immigrants | Eastern Asia
100.0
/100
|
#18
Exceptional
11.2%
Iranians
100.0
/100
|
#19
Exceptional
11.2%