Yakama vs Czech Child Poverty Among Boys Under 16

COMPARE

Yakama
Race
Ancestry
AfghanAfricanAlaska NativeAlaskan AthabascanAlbanianAleutAlsatianAmericanApacheArabArapahoArgentineanArmenianAssyrian/Chaldean/SyriacAustralianAustrianBahamianBangladeshiBarbadianBasqueBelgianBelizeanBermudanBhutaneseBlackfeetBolivianBrazilianBritishBritish West IndianBulgarianBurmeseCajunCambodianCanadianCape VerdeanCarpatho RusynCelticCentral AmericanCentral American IndianCherokeeCheyenneChickasawChileanChineseChippewaChoctawColombianColvilleComancheCosta RicanCreeCreekCroatianCrowCubanCypriotCzechoslovakianDanishDelawareDominicanDutchDutch West IndianEastern EuropeanEcuadorianEgyptianEnglishEstonianEthiopianEuropeanFijianFilipinoFinnishFrenchFrench American IndianFrench CanadianGermanGerman RussianGhanaianGreekGuamanian/ChamorroGuatemalanGuyaneseHaitianHmongHonduranHopiHoumaHungarianIcelanderIndian (Asian)IndonesianInupiatIranianIraqiIrishIroquoisIsraeliItalianJamaicanJapaneseJordanianKenyanKiowaKoreanLaotianLatvianLebaneseLiberianLithuanianLumbeeLuxembourgerMacedonianMalaysianMalteseMarshalleseMenomineeMexicanMexican American IndianMongolianMoroccanNative HawaiianNavajoNepaleseNew ZealanderNicaraguanNigerianNorthern EuropeanNorwegianOkinawanOsageOttawaPaiutePakistaniPalestinianPanamanianParaguayanPennsylvania GermanPeruvianPimaPolishPortuguesePotawatomiPuebloPuerto RicanPuget Sound SalishRomanianRussianSalvadoranSamoanScandinavianScotch-IrishScottishSeminoleSenegaleseSerbianShoshoneSierra LeoneanSiouxSlavicSlovakSloveneSomaliSouth AfricanSouth AmericanSouth American IndianSoviet UnionSpaniardSpanishSpanish AmericanSpanish American IndianSri LankanSubsaharan AfricanSudaneseSwedishSwissSyrianTaiwaneseThaiTlingit-HaidaTohono O'OdhamTonganTrinidadian and TobagonianTsimshianTurkishU.S. Virgin IslanderUgandanUkrainianUruguayanUteVenezuelanVietnameseWelshWest IndianYakamaYaquiYugoslavianYumanYup'ikZimbabwean
Immigration
NonimmigrantsImmigrantsAfghanistanAfricaAlbaniaArgentinaArmeniaAsiaAustraliaAustriaBahamasBangladeshBarbadosBelarusBelgiumBelizeBoliviaBosnia and HerzegovinaBrazilBulgariaBurma/MyanmarCabo VerdeCambodiaCameroonCanadaCaribbeanCentral AmericaChileChinaColombiaCongoCosta RicaCroatiaCubaCzechoslovakiaDenmarkDominicaDominican RepublicEastern AfricaEastern AsiaEastern EuropeEcuadorEgyptEl SalvadorEnglandEritreaEthiopiaEuropeFijiFranceGermanyGhanaGreeceGrenadaGuatemalaGuyanaHaitiHondurasHong KongHungaryIndiaIndonesiaIranIraqIrelandIsraelItalyJamaicaJapanJordanKazakhstanKenyaKoreaKuwaitLaosLatin AmericaLatviaLebanonLiberiaLithuaniaMalaysiaMexicoMicronesiaMiddle AfricaMoldovaMoroccoNepalNetherlandsNicaraguaNigeriaNorth AmericaNorth MacedoniaNorthern AfricaNorthern EuropeNorwayOceaniaPakistanPanamaPeruPhilippinesPolandPortugalRomaniaRussiaSaudi ArabiaScotlandSenegalSerbiaSierra LeoneSingaporeSomaliaSouth AfricaSouth AmericaSouth Central AsiaSouth Eastern AsiaSouthern EuropeSpainSri LankaSt. Vincent and the GrenadinesSudanSwedenSwitzerlandSyriaTaiwanThailandTrinidad and TobagoTurkeyUgandaUkraineUruguayUzbekistanVenezuelaVietnamWest IndiesWestern AfricaWestern AsiaWestern EuropeYemenZaireZimbabweAzores
Czech
Race
Ancestry
AfghanAfricanAlaska NativeAlaskan AthabascanAlbanianAleutAlsatianAmericanApacheArabArapahoArgentineanArmenianAssyrian/Chaldean/SyriacAustralianAustrianBahamianBangladeshiBarbadianBasqueBelgianBelizeanBermudanBhutaneseBlackfeetBolivianBrazilianBritishBritish West IndianBulgarianBurmeseCajunCambodianCanadianCape VerdeanCarpatho RusynCelticCentral AmericanCentral American IndianCherokeeCheyenneChickasawChileanChineseChippewaChoctawColombianColvilleComancheCosta RicanCreeCreekCroatianCrowCubanCypriotCzechCzechoslovakianDanishDelawareDominicanDutchDutch West IndianEastern EuropeanEcuadorianEgyptianEnglishEstonianEthiopianEuropeanFijianFilipinoFinnishFrenchFrench American IndianFrench CanadianGermanGerman RussianGhanaianGreekGuamanian/ChamorroGuatemalanGuyaneseHaitianHmongHonduranHopiHoumaHungarianIcelanderIndian (Asian)IndonesianInupiatIranianIraqiIrishIroquoisIsraeliItalianJamaicanJapaneseJordanianKenyanKiowaKoreanLaotianLatvianLebaneseLiberianLithuanianLumbeeLuxembourgerMacedonianMalaysianMalteseMarshalleseMenomineeMexicanMexican American IndianMongolianMoroccanNative HawaiianNavajoNepaleseNew ZealanderNicaraguanNigerianNorthern EuropeanNorwegianOkinawanOsageOttawaPaiutePakistaniPalestinianPanamanianParaguayanPennsylvania GermanPeruvianPimaPolishPortuguesePotawatomiPuebloPuerto RicanPuget Sound SalishRomanianRussianSalvadoranSamoanScandinavianScotch-IrishScottishSeminoleSenegaleseSerbianShoshoneSierra LeoneanSiouxSlavicSlovakSloveneSomaliSouth AfricanSouth AmericanSouth American IndianSoviet UnionSpaniardSpanishSpanish AmericanSpanish American IndianSri LankanSubsaharan AfricanSudaneseSwedishSwissSyrianTaiwaneseThaiTlingit-HaidaTohono O'OdhamTonganTrinidadian and TobagonianTsimshianTurkishU.S. Virgin IslanderUgandanUkrainianUruguayanUteVenezuelanVietnameseWelshWest IndianYaquiYugoslavianYumanYup'ikZimbabwean
Immigration
NonimmigrantsImmigrantsAfghanistanAfricaAlbaniaArgentinaArmeniaAsiaAustraliaAustriaBahamasBangladeshBarbadosBelarusBelgiumBelizeBoliviaBosnia and HerzegovinaBrazilBulgariaBurma/MyanmarCabo VerdeCambodiaCameroonCanadaCaribbeanCentral AmericaChileChinaColombiaCongoCosta RicaCroatiaCubaCzechoslovakiaDenmarkDominicaDominican RepublicEastern AfricaEastern AsiaEastern EuropeEcuadorEgyptEl SalvadorEnglandEritreaEthiopiaEuropeFijiFranceGermanyGhanaGreeceGrenadaGuatemalaGuyanaHaitiHondurasHong KongHungaryIndiaIndonesiaIranIraqIrelandIsraelItalyJamaicaJapanJordanKazakhstanKenyaKoreaKuwaitLaosLatin AmericaLatviaLebanonLiberiaLithuaniaMalaysiaMexicoMicronesiaMiddle AfricaMoldovaMoroccoNepalNetherlandsNicaraguaNigeriaNorth AmericaNorth MacedoniaNorthern AfricaNorthern EuropeNorwayOceaniaPakistanPanamaPeruPhilippinesPolandPortugalRomaniaRussiaSaudi ArabiaScotlandSenegalSerbiaSierra LeoneSingaporeSomaliaSouth AfricaSouth AmericaSouth Central AsiaSouth Eastern AsiaSouthern EuropeSpainSri LankaSt. Vincent and the GrenadinesSudanSwedenSwitzerlandSyriaTaiwanThailandTrinidad and TobagoTurkeyUgandaUkraineUruguayUzbekistanVenezuelaVietnamWest IndiesWestern AfricaWestern AsiaWestern EuropeYemenZaireZimbabweAzores
Child Poverty Among Boys Under 16
Income
Poverty
Unemployment
Labor Participation
Family Structure
Vehicle Availability
Education Level
Disability

Child Poverty Among Boys Under 16 Comparison

Yakama

Czechs

Tragic
Exceptional
21.7%
CHILD POVERTY AMONG BOYS UNDER 16
0.0/ 100
METRIC RATING
318th/ 347
METRIC RANK
14.1%
CHILD POVERTY AMONG BOYS UNDER 16
99.3/ 100
METRIC RATING
49th/ 347
METRIC RANK

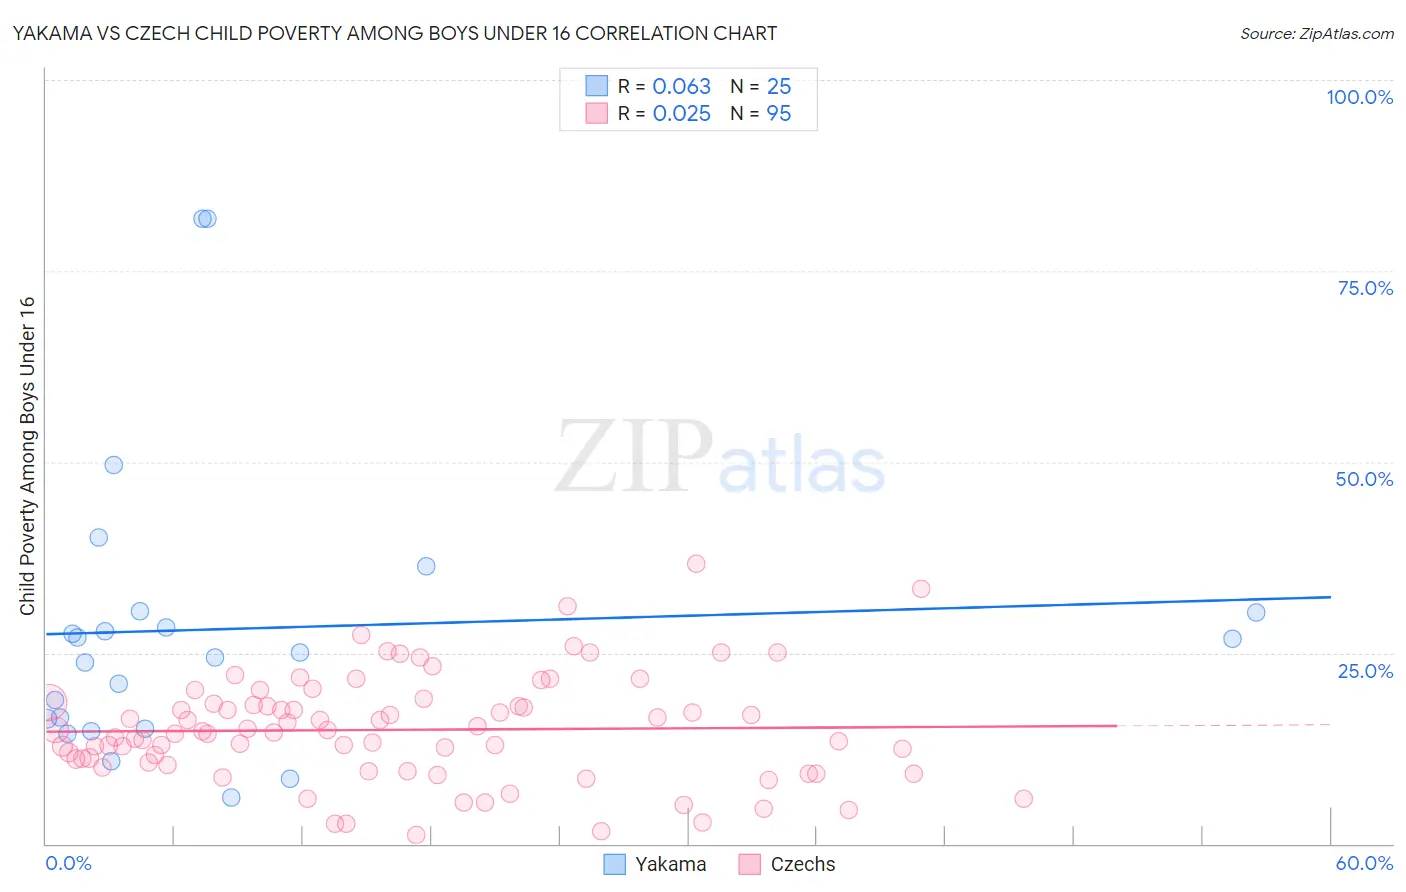
Yakama vs Czech Child Poverty Among Boys Under 16 Correlation Chart

The statistical analysis conducted on geographies consisting of 19,821,804 people shows a slight positive correlation between the proportion of Yakama and poverty level among boys under the age of 16 in the United States with a correlation coefficient (R) of 0.063 and weighted average of 21.7%. Similarly, the statistical analysis conducted on geographies consisting of 471,396,955 people shows no correlation between the proportion of Czechs and poverty level among boys under the age of 16 in the United States with a correlation coefficient (R) of 0.025 and weighted average of 14.1%, a difference of 53.8%.
Yakama vs Czech Child Poverty Among Boys Under 16

Child Poverty Among Boys Under 16 Correlation Summary

MeasurementYakamaCzech
Minimum6.1%1.1%
Maximum81.8%36.6%
Range75.8%35.5%
Mean28.1%14.9%
Median25.0%14.5%
Interquartile 25% (IQ1)15.7%10.2%
Interquartile 75% (IQ3)30.4%18.4%
Interquartile Range (IQR)14.7%8.1%
Standard Deviation (Sample)18.9%7.0%
Standard Deviation (Population)18.6%6.9%

Similar Demographics by Child Poverty Among Boys Under 16

Demographics Similar to Yakama by Child Poverty Among Boys Under 16

In terms of child poverty among boys under 16, the demographic groups most similar to Yakama are African (21.7%, a difference of 0.060%), Immigrants from Somalia (21.7%, a difference of 0.14%), Menominee (21.7%, a difference of 0.14%), Dutch West Indian (21.8%, a difference of 0.48%), and Ute (21.6%, a difference of 0.74%).
DemographicsRating | RankChild Poverty Among Boys Under 16
Bahamians
0.0
/100
|
#311
Tragic
21.6%
Immigrants | Guatemala
0.0
/100
|
#312
Tragic
21.6%
British West Indians
0.0
/100
|
#313
Tragic
21.6%
Ute
0.0
/100
|
#314
Tragic
21.6%
Immigrants | Somalia
0.0
/100
|
#315
Tragic
21.7%
Menominee
0.0
/100
|
#316
Tragic
21.7%
Africans
0.0
/100
|
#317
Tragic
21.7%
Yakama
0.0
/100
|
#318
Tragic
21.7%
Dutch West Indians
0.0
/100
|
#319
Tragic
21.8%
U.S. Virgin Islanders
0.0
/100
|
#320
Tragic
22.0%
Cajuns
0.0
/100
|
#321
Tragic
22.2%
Immigrants | Dominica
0.0
/100
|
#322
Tragic
22.2%
Hondurans
0.0
/100
|
#323
Tragic
22.3%
Immigrants | Congo
0.0
/100
|
#324
Tragic
22.4%
Central American Indians
0.0
/100
|
#325
Tragic
22.5%

Demographics Similar to Czechs by Child Poverty Among Boys Under 16

In terms of child poverty among boys under 16, the demographic groups most similar to Czechs are Immigrants from Indonesia (14.1%, a difference of 0.090%), Immigrants from Moldova (14.1%, a difference of 0.11%), Greek (14.1%, a difference of 0.38%), Immigrants from Scotland (14.1%, a difference of 0.48%), and Italian (14.2%, a difference of 0.49%).
DemographicsRating | RankChild Poverty Among Boys Under 16
Koreans
99.6
/100
|
#42
Exceptional
14.0%
Croatians
99.5
/100
|
#43
Exceptional
14.0%
Estonians
99.4
/100
|
#44
Exceptional
14.1%
Immigrants | Scotland
99.4
/100
|
#45
Exceptional
14.1%
Greeks
99.4
/100
|
#46
Exceptional
14.1%
Immigrants | Moldova
99.4
/100
|
#47
Exceptional
14.1%
Immigrants | Indonesia
99.4
/100
|
#48
Exceptional
14.1%
Czechs
99.3
/100
|
#49
Exceptional
14.1%
Italians
99.2
/100
|
#50
Exceptional
14.2%
Immigrants | Greece
99.2
/100
|
#51
Exceptional
14.2%
Laotians
99.0
/100
|
#52
Exceptional
14.3%
Immigrants | Philippines
99.0
/100
|
#53
Exceptional
14.3%
Immigrants | Serbia
99.0
/100
|
#54
Exceptional
14.3%
Immigrants | Pakistan
99.0
/100
|
#55
Exceptional
14.3%
Zimbabweans
99.0
/100
|
#56
Exceptional
14.3%