White/Caucasian vs Immigrants from Haiti Single Male Poverty
COMPARE
White/Caucasian
Immigrants from Haiti
Single Male Poverty
Single Male Poverty Comparison
Whites/Caucasians
Immigrants from Haiti
14.5%
SINGLE MALE POVERTY
0.0/ 100
METRIC RATING
288th/ 347
METRIC RANK
13.1%
SINGLE MALE POVERTY
16.8/ 100
METRIC RATING
210th/ 347
METRIC RANK
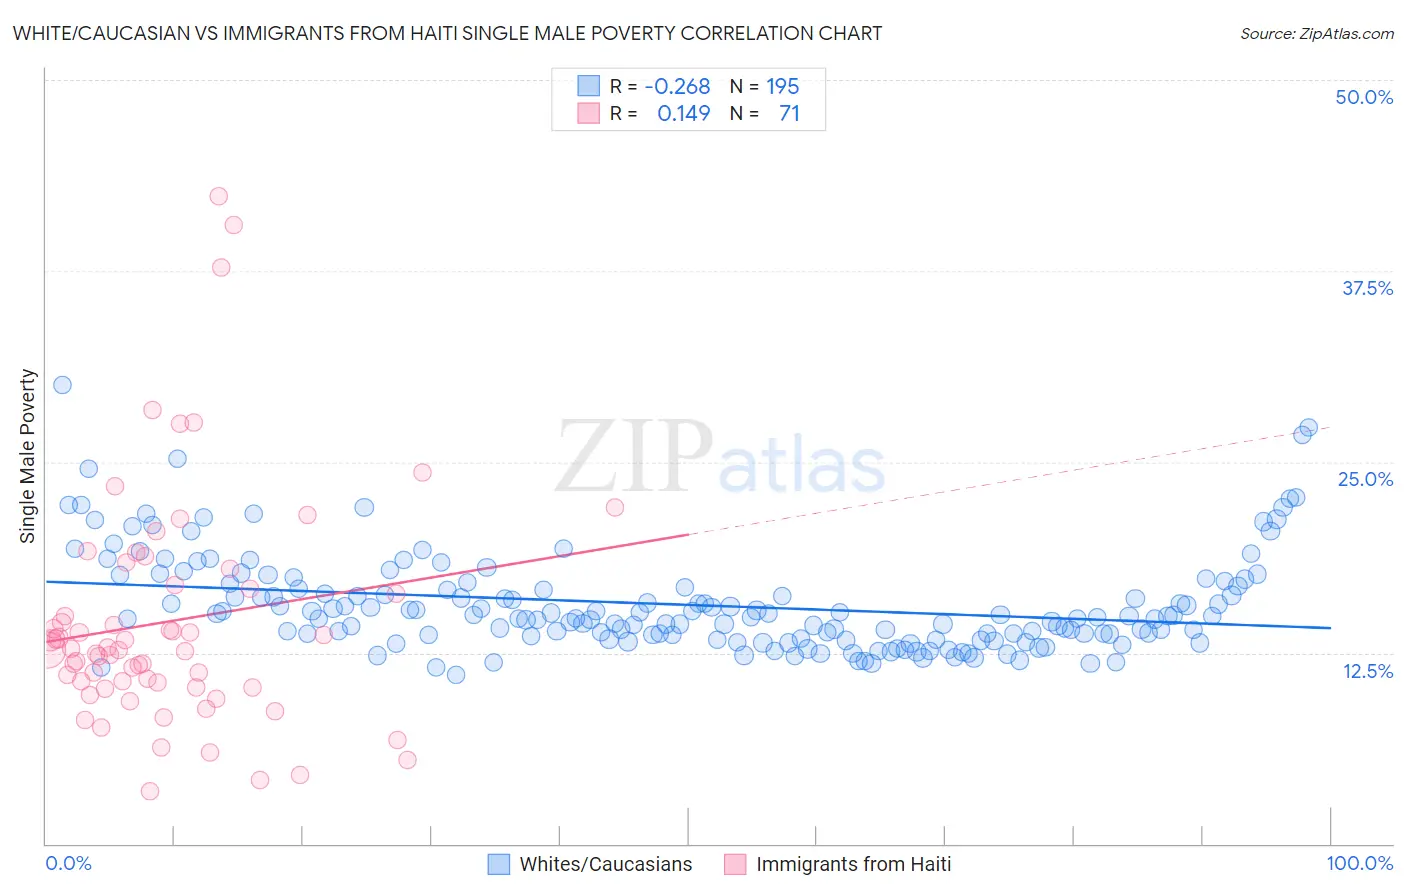
White/Caucasian vs Immigrants from Haiti Single Male Poverty Correlation Chart
The statistical analysis conducted on geographies consisting of 478,066,159 people shows a weak negative correlation between the proportion of Whites/Caucasians and poverty level among single males in the United States with a correlation coefficient (R) of -0.268 and weighted average of 14.5%. Similarly, the statistical analysis conducted on geographies consisting of 207,631,435 people shows a poor positive correlation between the proportion of Immigrants from Haiti and poverty level among single males in the United States with a correlation coefficient (R) of 0.149 and weighted average of 13.1%, a difference of 10.9%.
Single Male Poverty Correlation Summary
| Measurement | White/Caucasian | Immigrants from Haiti |
| Minimum | 11.1% | 3.4% |
| Maximum | 30.0% | 42.4% |
| Range | 19.0% | 39.0% |
| Mean | 15.6% | 14.6% |
| Median | 14.8% | 12.7% |
| Interquartile 25% (IQ1) | 13.6% | 10.2% |
| Interquartile 75% (IQ3) | 16.8% | 17.0% |
| Interquartile Range (IQR) | 3.2% | 6.8% |
| Standard Deviation (Sample) | 3.2% | 7.7% |
| Standard Deviation (Population) | 3.2% | 7.6% |
Similar Demographics by Single Male Poverty
Demographics Similar to Whites/Caucasians by Single Male Poverty
In terms of single male poverty, the demographic groups most similar to Whites/Caucasians are Iroquois (14.5%, a difference of 0.0%), Immigrants from Dominica (14.5%, a difference of 0.090%), Celtic (14.5%, a difference of 0.13%), U.S. Virgin Islander (14.5%, a difference of 0.31%), and French (14.4%, a difference of 0.45%).
| Demographics | Rating | Rank | Single Male Poverty |
| Hispanics or Latinos | 0.0 /100 | #281 | Tragic 14.2% |
| Spanish Americans | 0.0 /100 | #282 | Tragic 14.2% |
| Yaqui | 0.0 /100 | #283 | Tragic 14.2% |
| Immigrants | Bahamas | 0.0 /100 | #284 | Tragic 14.4% |
| French | 0.0 /100 | #285 | Tragic 14.4% |
| Celtics | 0.0 /100 | #286 | Tragic 14.5% |
| Iroquois | 0.0 /100 | #287 | Tragic 14.5% |
| Whites/Caucasians | 0.0 /100 | #288 | Tragic 14.5% |
| Immigrants | Dominica | 0.0 /100 | #289 | Tragic 14.5% |
| U.S. Virgin Islanders | 0.0 /100 | #290 | Tragic 14.5% |
| Bahamians | 0.0 /100 | #291 | Tragic 14.6% |
| Immigrants | Nonimmigrants | 0.0 /100 | #292 | Tragic 14.6% |
| French Canadians | 0.0 /100 | #293 | Tragic 14.6% |
| Ottawa | 0.0 /100 | #294 | Tragic 14.6% |
| Scotch-Irish | 0.0 /100 | #295 | Tragic 14.7% |
Demographics Similar to Immigrants from Haiti by Single Male Poverty
In terms of single male poverty, the demographic groups most similar to Immigrants from Haiti are Swedish (13.1%, a difference of 0.010%), Senegalese (13.1%, a difference of 0.040%), Mexican American Indian (13.1%, a difference of 0.060%), Immigrants from Western Africa (13.1%, a difference of 0.070%), and Sudanese (13.1%, a difference of 0.080%).
| Demographics | Rating | Rank | Single Male Poverty |
| Immigrants | Bangladesh | 20.4 /100 | #203 | Fair 13.0% |
| Estonians | 20.3 /100 | #204 | Fair 13.0% |
| Poles | 19.3 /100 | #205 | Poor 13.0% |
| Northern Europeans | 18.9 /100 | #206 | Poor 13.0% |
| Sudanese | 17.7 /100 | #207 | Poor 13.1% |
| Immigrants | Western Africa | 17.6 /100 | #208 | Poor 13.1% |
| Mexican American Indians | 17.5 /100 | #209 | Poor 13.1% |
| Immigrants | Haiti | 16.8 /100 | #210 | Poor 13.1% |
| Swedes | 16.8 /100 | #211 | Poor 13.1% |
| Senegalese | 16.4 /100 | #212 | Poor 13.1% |
| Italians | 15.9 /100 | #213 | Poor 13.1% |
| Zimbabweans | 14.9 /100 | #214 | Poor 13.1% |
| Japanese | 14.8 /100 | #215 | Poor 13.1% |
| Austrians | 13.9 /100 | #216 | Poor 13.1% |
| Bermudans | 13.0 /100 | #217 | Poor 13.1% |