West Indian vs Spanish American Poverty
COMPARE
West Indian
Spanish American
Poverty
Poverty Comparison
West Indians
Spanish Americans
15.0%
POVERTY
0.0/ 100
METRIC RATING
284th/ 347
METRIC RANK
14.7%
POVERTY
0.0/ 100
METRIC RATING
273rd/ 347
METRIC RANK
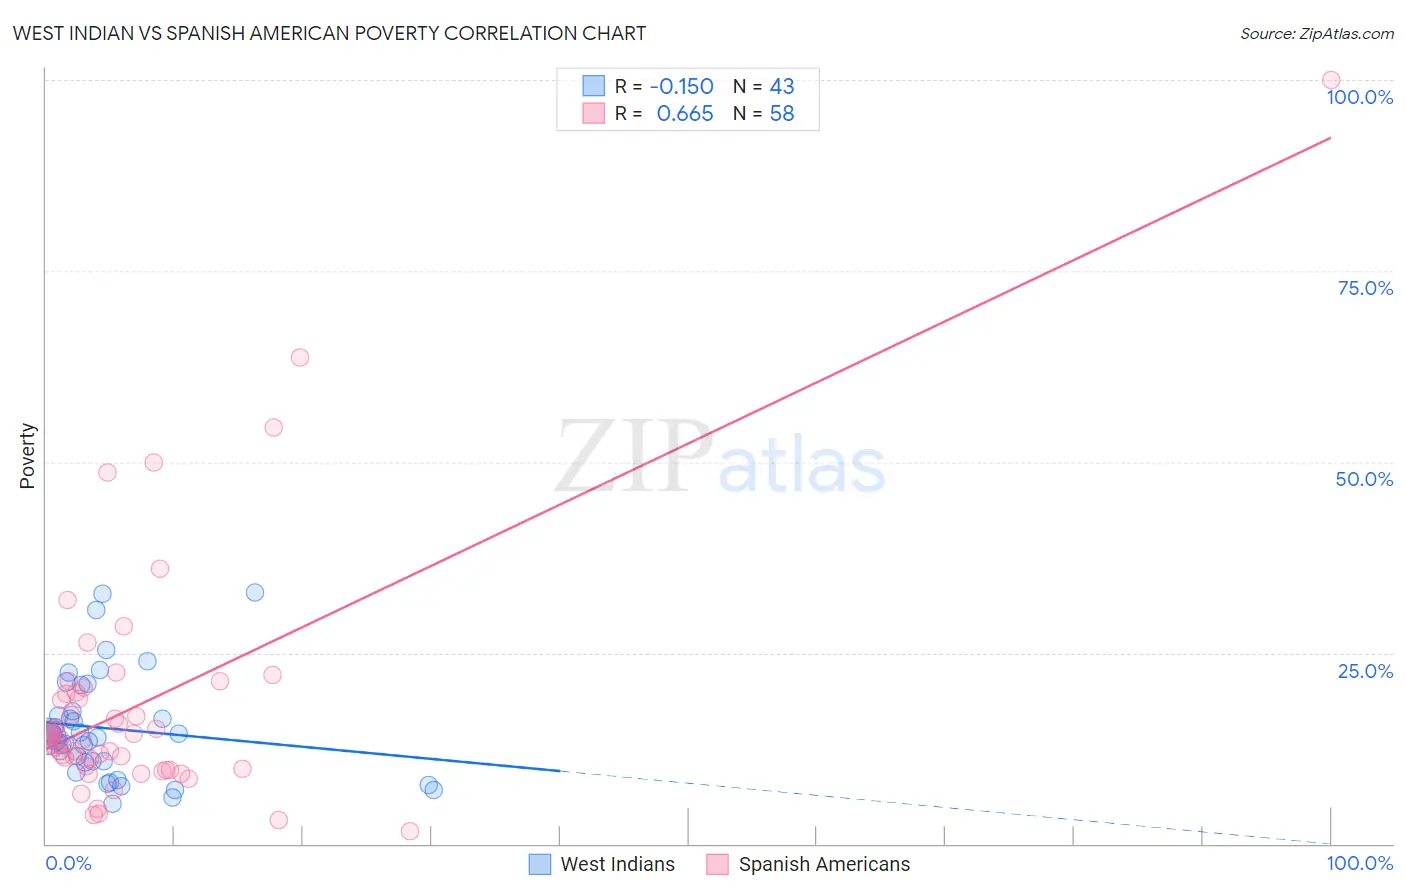
West Indian vs Spanish American Poverty Correlation Chart
The statistical analysis conducted on geographies consisting of 253,897,912 people shows a poor negative correlation between the proportion of West Indians and poverty level in the United States with a correlation coefficient (R) of -0.150 and weighted average of 15.0%. Similarly, the statistical analysis conducted on geographies consisting of 103,164,738 people shows a significant positive correlation between the proportion of Spanish Americans and poverty level in the United States with a correlation coefficient (R) of 0.665 and weighted average of 14.7%, a difference of 1.6%.
Poverty Correlation Summary
| Measurement | West Indian | Spanish American |
| Minimum | 5.3% | 1.6% |
| Maximum | 32.8% | 100.0% |
| Range | 27.5% | 98.4% |
| Mean | 15.1% | 18.4% |
| Median | 14.1% | 13.8% |
| Interquartile 25% (IQ1) | 10.6% | 9.8% |
| Interquartile 75% (IQ3) | 17.3% | 19.8% |
| Interquartile Range (IQR) | 6.7% | 10.0% |
| Standard Deviation (Sample) | 6.9% | 16.4% |
| Standard Deviation (Population) | 6.8% | 16.3% |
Demographics Similar to West Indians and Spanish Americans by Poverty
In terms of poverty, the demographic groups most similar to West Indians are Vietnamese (15.0%, a difference of 0.050%), Immigrants from Haiti (15.0%, a difference of 0.10%), Comanche (15.0%, a difference of 0.23%), Immigrants from Latin America (15.0%, a difference of 0.32%), and Inupiat (15.1%, a difference of 0.53%). Similarly, the demographic groups most similar to Spanish Americans are Barbadian (14.8%, a difference of 0.39%), Immigrants from West Indies (14.8%, a difference of 0.43%), Immigrants from Bahamas (14.8%, a difference of 0.43%), Bangladeshi (14.8%, a difference of 0.48%), and Belizean (14.8%, a difference of 0.50%).
| Demographics | Rating | Rank | Poverty |
| Sub-Saharan Africans | 0.1 /100 | #268 | Tragic 14.5% |
| Immigrants | Cuba | 0.1 /100 | #269 | Tragic 14.6% |
| Central Americans | 0.1 /100 | #270 | Tragic 14.6% |
| Shoshone | 0.0 /100 | #271 | Tragic 14.7% |
| Chickasaw | 0.0 /100 | #272 | Tragic 14.7% |
| Spanish Americans | 0.0 /100 | #273 | Tragic 14.7% |
| Barbadians | 0.0 /100 | #274 | Tragic 14.8% |
| Immigrants | West Indies | 0.0 /100 | #275 | Tragic 14.8% |
| Immigrants | Bahamas | 0.0 /100 | #276 | Tragic 14.8% |
| Bangladeshis | 0.0 /100 | #277 | Tragic 14.8% |
| Belizeans | 0.0 /100 | #278 | Tragic 14.8% |
| Immigrants | St. Vincent and the Grenadines | 0.0 /100 | #279 | Tragic 14.9% |
| Haitians | 0.0 /100 | #280 | Tragic 14.9% |
| Immigrants | Barbados | 0.0 /100 | #281 | Tragic 14.9% |
| Comanche | 0.0 /100 | #282 | Tragic 15.0% |
| Immigrants | Haiti | 0.0 /100 | #283 | Tragic 15.0% |
| West Indians | 0.0 /100 | #284 | Tragic 15.0% |
| Vietnamese | 0.0 /100 | #285 | Tragic 15.0% |
| Immigrants | Latin America | 0.0 /100 | #286 | Tragic 15.0% |
| Inupiat | 0.0 /100 | #287 | Tragic 15.1% |
| Yaqui | 0.0 /100 | #288 | Tragic 15.1% |