Welsh vs Immigrants from Latvia Single Male Poverty
COMPARE
Welsh
Immigrants from Latvia
Single Male Poverty
Single Male Poverty Comparison
Welsh
Immigrants from Latvia
14.0%
SINGLE MALE POVERTY
0.1/ 100
METRIC RATING
273rd/ 347
METRIC RANK
12.2%
SINGLE MALE POVERTY
97.0/ 100
METRIC RATING
101st/ 347
METRIC RANK
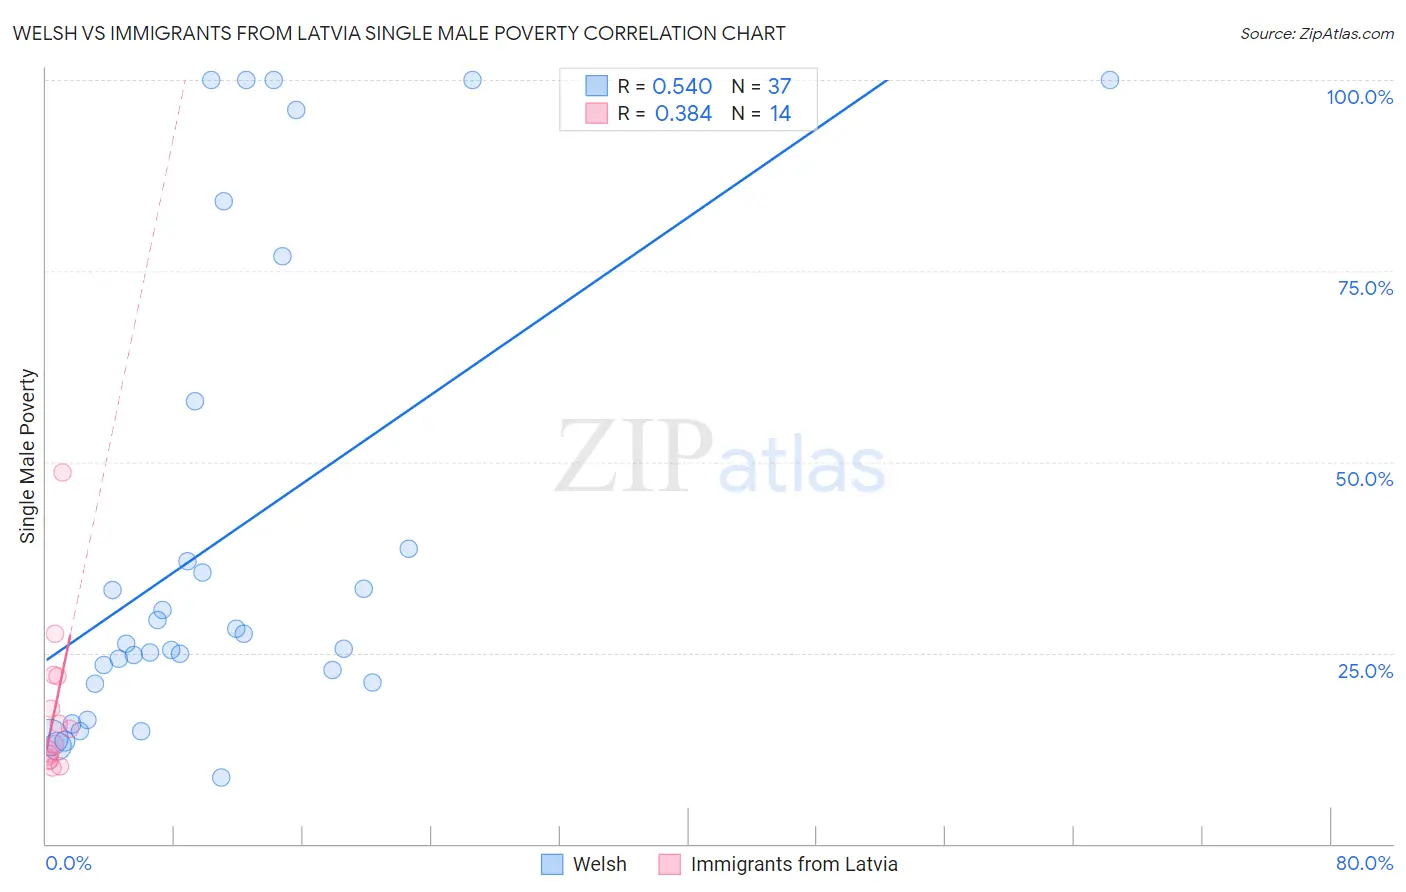
Welsh vs Immigrants from Latvia Single Male Poverty Correlation Chart
The statistical analysis conducted on geographies consisting of 442,898,896 people shows a substantial positive correlation between the proportion of Welsh and poverty level among single males in the United States with a correlation coefficient (R) of 0.540 and weighted average of 14.0%. Similarly, the statistical analysis conducted on geographies consisting of 106,119,330 people shows a mild positive correlation between the proportion of Immigrants from Latvia and poverty level among single males in the United States with a correlation coefficient (R) of 0.384 and weighted average of 12.2%, a difference of 14.9%.
Single Male Poverty Correlation Summary
| Measurement | Welsh | Immigrants from Latvia |
| Minimum | 8.7% | 9.9% |
| Maximum | 100.0% | 48.6% |
| Range | 91.3% | 38.7% |
| Mean | 40.1% | 17.7% |
| Median | 26.2% | 14.1% |
| Interquartile 25% (IQ1) | 21.0% | 11.0% |
| Interquartile 75% (IQ3) | 48.3% | 22.0% |
| Interquartile Range (IQR) | 27.3% | 11.0% |
| Standard Deviation (Sample) | 30.6% | 10.4% |
| Standard Deviation (Population) | 30.2% | 10.0% |
Similar Demographics by Single Male Poverty
Demographics Similar to Welsh by Single Male Poverty
In terms of single male poverty, the demographic groups most similar to Welsh are Honduran (14.0%, a difference of 0.13%), English (14.1%, a difference of 0.21%), Dutch (14.1%, a difference of 0.32%), Mexican (14.0%, a difference of 0.35%), and Immigrants from Honduras (14.1%, a difference of 0.36%).
| Demographics | Rating | Rank | Single Male Poverty |
| Immigrants | Cabo Verde | 0.1 /100 | #266 | Tragic 13.9% |
| Germans | 0.1 /100 | #267 | Tragic 13.9% |
| Immigrants | Mexico | 0.1 /100 | #268 | Tragic 13.9% |
| Scottish | 0.1 /100 | #269 | Tragic 14.0% |
| Immigrants | Saudi Arabia | 0.1 /100 | #270 | Tragic 14.0% |
| Irish | 0.1 /100 | #271 | Tragic 14.0% |
| Mexicans | 0.1 /100 | #272 | Tragic 14.0% |
| Welsh | 0.1 /100 | #273 | Tragic 14.0% |
| Hondurans | 0.1 /100 | #274 | Tragic 14.0% |
| English | 0.1 /100 | #275 | Tragic 14.1% |
| Dutch | 0.1 /100 | #276 | Tragic 14.1% |
| Immigrants | Honduras | 0.0 /100 | #277 | Tragic 14.1% |
| Slovaks | 0.0 /100 | #278 | Tragic 14.1% |
| Indonesians | 0.0 /100 | #279 | Tragic 14.1% |
| Hmong | 0.0 /100 | #280 | Tragic 14.2% |
Demographics Similar to Immigrants from Latvia by Single Male Poverty
In terms of single male poverty, the demographic groups most similar to Immigrants from Latvia are Immigrants from Europe (12.2%, a difference of 0.010%), Immigrants from Australia (12.2%, a difference of 0.030%), Immigrants from Cuba (12.2%, a difference of 0.15%), Immigrants from Armenia (12.2%, a difference of 0.15%), and Immigrants from Kazakhstan (12.2%, a difference of 0.15%).
| Demographics | Rating | Rank | Single Male Poverty |
| Colombians | 97.8 /100 | #94 | Exceptional 12.2% |
| Mongolians | 97.7 /100 | #95 | Exceptional 12.2% |
| Immigrants | Sweden | 97.5 /100 | #96 | Exceptional 12.2% |
| Immigrants | Italy | 97.4 /100 | #97 | Exceptional 12.2% |
| Guamanians/Chamorros | 97.4 /100 | #98 | Exceptional 12.2% |
| Immigrants | Cuba | 97.3 /100 | #99 | Exceptional 12.2% |
| Immigrants | Australia | 97.1 /100 | #100 | Exceptional 12.2% |
| Immigrants | Latvia | 97.0 /100 | #101 | Exceptional 12.2% |
| Immigrants | Europe | 97.0 /100 | #102 | Exceptional 12.2% |
| Immigrants | Armenia | 96.7 /100 | #103 | Exceptional 12.2% |
| Immigrants | Kazakhstan | 96.7 /100 | #104 | Exceptional 12.2% |
| Jordanians | 95.9 /100 | #105 | Exceptional 12.3% |
| Immigrants | Morocco | 95.6 /100 | #106 | Exceptional 12.3% |
| Iraqis | 95.1 /100 | #107 | Exceptional 12.3% |
| Immigrants | Eastern Africa | 95.0 /100 | #108 | Exceptional 12.3% |