Vietnamese vs Pueblo Single Father Poverty
COMPARE
Vietnamese
Pueblo
Single Father Poverty
Single Father Poverty Comparison
Vietnamese
Pueblo
16.3%
SINGLE FATHER POVERTY
48.0/ 100
METRIC RATING
176th/ 347
METRIC RANK
21.1%
SINGLE FATHER POVERTY
0.0/ 100
METRIC RATING
328th/ 347
METRIC RANK
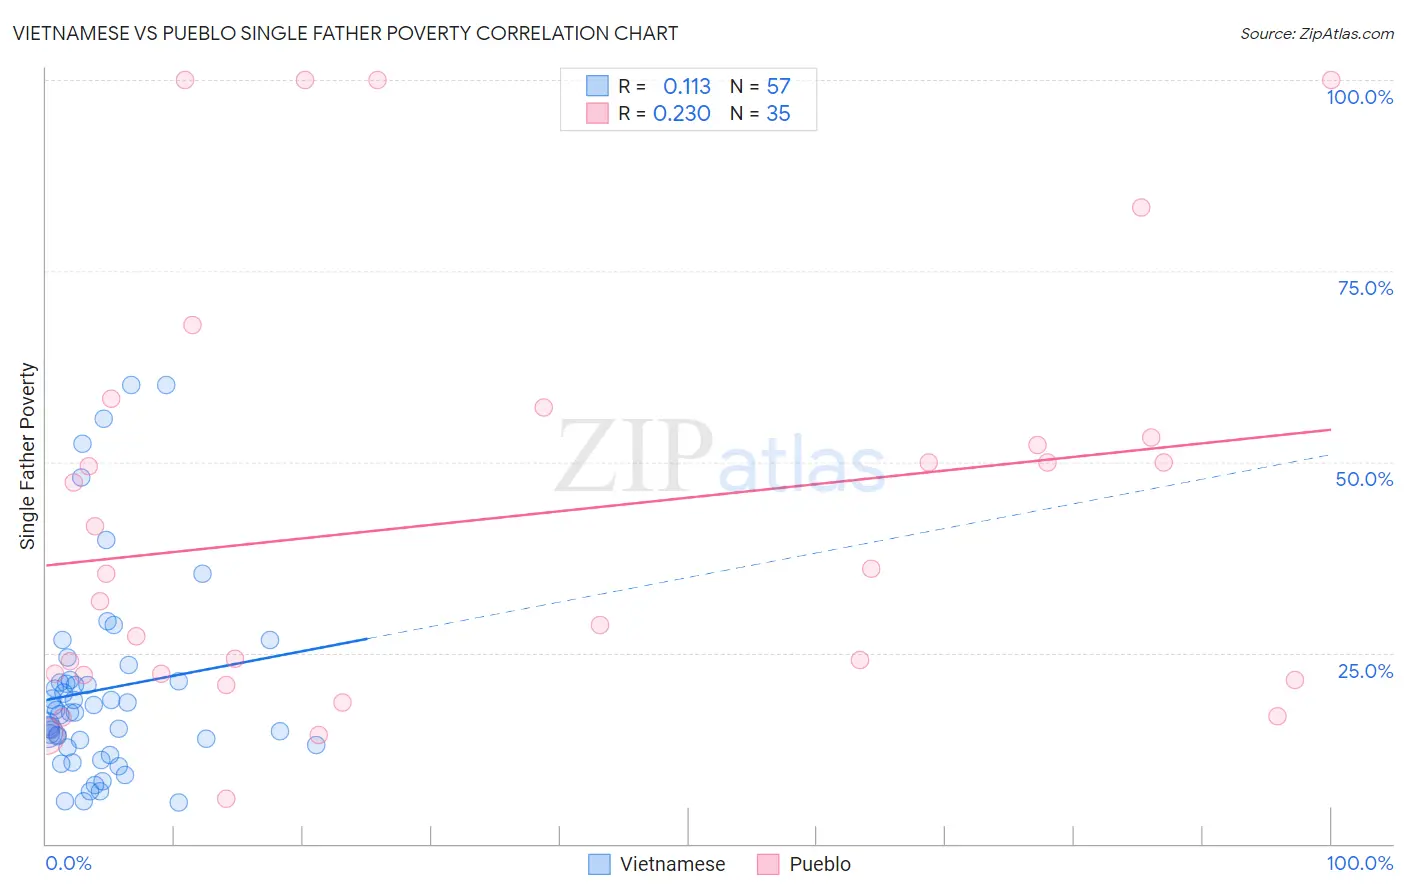
Vietnamese vs Pueblo Single Father Poverty Correlation Chart
The statistical analysis conducted on geographies consisting of 147,063,845 people shows a poor positive correlation between the proportion of Vietnamese and poverty level among single fathers in the United States with a correlation coefficient (R) of 0.113 and weighted average of 16.3%. Similarly, the statistical analysis conducted on geographies consisting of 109,475,284 people shows a weak positive correlation between the proportion of Pueblo and poverty level among single fathers in the United States with a correlation coefficient (R) of 0.230 and weighted average of 21.1%, a difference of 29.5%.
Single Father Poverty Correlation Summary
| Measurement | Vietnamese | Pueblo |
| Minimum | 5.4% | 5.9% |
| Maximum | 60.0% | 100.0% |
| Range | 54.6% | 94.1% |
| Mean | 20.2% | 42.5% |
| Median | 17.2% | 35.3% |
| Interquartile 25% (IQ1) | 12.7% | 22.1% |
| Interquartile 75% (IQ3) | 21.4% | 53.2% |
| Interquartile Range (IQR) | 8.6% | 31.2% |
| Standard Deviation (Sample) | 13.0% | 27.2% |
| Standard Deviation (Population) | 12.9% | 26.8% |
Similar Demographics by Single Father Poverty
Demographics Similar to Vietnamese by Single Father Poverty
In terms of single father poverty, the demographic groups most similar to Vietnamese are Immigrants from Ecuador (16.3%, a difference of 0.070%), Immigrants from Sierra Leone (16.3%, a difference of 0.090%), Immigrants from St. Vincent and the Grenadines (16.3%, a difference of 0.090%), Swedish (16.3%, a difference of 0.090%), and Immigrants from Morocco (16.3%, a difference of 0.12%).
| Demographics | Rating | Rank | Single Father Poverty |
| Northern Europeans | 52.8 /100 | #169 | Average 16.3% |
| Scandinavians | 52.3 /100 | #170 | Average 16.3% |
| Immigrants | Morocco | 50.7 /100 | #171 | Average 16.3% |
| Immigrants | Sierra Leone | 50.1 /100 | #172 | Average 16.3% |
| Immigrants | St. Vincent and the Grenadines | 50.0 /100 | #173 | Average 16.3% |
| Swedes | 50.0 /100 | #174 | Average 16.3% |
| Immigrants | Ecuador | 49.7 /100 | #175 | Average 16.3% |
| Vietnamese | 48.0 /100 | #176 | Average 16.3% |
| Immigrants | South Africa | 44.2 /100 | #177 | Average 16.3% |
| Immigrants | Cuba | 41.6 /100 | #178 | Average 16.4% |
| Serbians | 40.9 /100 | #179 | Average 16.4% |
| Immigrants | Latin America | 37.2 /100 | #180 | Fair 16.4% |
| Immigrants | Western Africa | 36.0 /100 | #181 | Fair 16.4% |
| Immigrants | Italy | 35.7 /100 | #182 | Fair 16.4% |
| Aleuts | 35.3 /100 | #183 | Fair 16.4% |
Demographics Similar to Pueblo by Single Father Poverty
In terms of single father poverty, the demographic groups most similar to Pueblo are Colville (21.4%, a difference of 1.1%), Choctaw (20.7%, a difference of 1.9%), Paiute (21.6%, a difference of 2.4%), Immigrants from Yemen (20.6%, a difference of 2.6%), and Central American Indian (21.7%, a difference of 2.6%).
| Demographics | Rating | Rank | Single Father Poverty |
| Cherokee | 0.0 /100 | #321 | Tragic 19.6% |
| Creek | 0.0 /100 | #322 | Tragic 19.8% |
| Pennsylvania Germans | 0.0 /100 | #323 | Tragic 20.0% |
| Americans | 0.0 /100 | #324 | Tragic 20.1% |
| Blacks/African Americans | 0.0 /100 | #325 | Tragic 20.4% |
| Immigrants | Yemen | 0.0 /100 | #326 | Tragic 20.6% |
| Choctaw | 0.0 /100 | #327 | Tragic 20.7% |
| Pueblo | 0.0 /100 | #328 | Tragic 21.1% |
| Colville | 0.0 /100 | #329 | Tragic 21.4% |
| Paiute | 0.0 /100 | #330 | Tragic 21.6% |
| Central American Indians | 0.0 /100 | #331 | Tragic 21.7% |
| Tohono O'odham | 0.0 /100 | #332 | Tragic 22.0% |
| Natives/Alaskans | 0.0 /100 | #333 | Tragic 22.4% |
| Kiowa | 0.0 /100 | #334 | Tragic 22.5% |
| Shoshone | 0.0 /100 | #335 | Tragic 22.9% |