Vietnamese vs Immigrants from Vietnam Family Poverty

COMPARE

Vietnamese
Race
Ancestry
AfghanAfricanAlaska NativeAlaskan AthabascanAlbanianAleutAlsatianAmericanApacheArabArapahoArgentineanArmenianAssyrian/Chaldean/SyriacAustralianAustrianBahamianBangladeshiBarbadianBasqueBelgianBelizeanBermudanBhutaneseBlackfeetBolivianBrazilianBritishBritish West IndianBulgarianBurmeseCajunCambodianCanadianCape VerdeanCarpatho RusynCelticCentral AmericanCentral American IndianCherokeeCheyenneChickasawChileanChineseChippewaChoctawColombianColvilleComancheCosta RicanCreeCreekCroatianCrowCubanCypriotCzechCzechoslovakianDanishDelawareDominicanDutchDutch West IndianEastern EuropeanEcuadorianEgyptianEnglishEstonianEthiopianEuropeanFijianFilipinoFinnishFrenchFrench American IndianFrench CanadianGermanGerman RussianGhanaianGreekGuamanian/ChamorroGuatemalanGuyaneseHaitianHmongHonduranHopiHoumaHungarianIcelanderIndian (Asian)IndonesianInupiatIranianIraqiIrishIroquoisIsraeliItalianJamaicanJapaneseJordanianKenyanKiowaKoreanLaotianLatvianLebaneseLiberianLithuanianLumbeeLuxembourgerMacedonianMalaysianMalteseMarshalleseMenomineeMexicanMexican American IndianMongolianMoroccanNative HawaiianNavajoNepaleseNew ZealanderNicaraguanNigerianNorthern EuropeanNorwegianOkinawanOsageOttawaPaiutePakistaniPalestinianPanamanianParaguayanPennsylvania GermanPeruvianPimaPolishPortuguesePotawatomiPuebloPuerto RicanPuget Sound SalishRomanianRussianSalvadoranSamoanScandinavianScotch-IrishScottishSeminoleSenegaleseSerbianShoshoneSierra LeoneanSiouxSlavicSlovakSloveneSomaliSouth AfricanSouth AmericanSouth American IndianSoviet UnionSpaniardSpanishSpanish AmericanSpanish American IndianSri LankanSubsaharan AfricanSudaneseSwedishSwissSyrianTaiwaneseThaiTlingit-HaidaTohono O'OdhamTonganTrinidadian and TobagonianTsimshianTurkishU.S. Virgin IslanderUgandanUkrainianUruguayanUteVenezuelanVietnameseWelshWest IndianYakamaYaquiYugoslavianYumanYup'ikZimbabwean
Immigration
NonimmigrantsImmigrantsAfghanistanAfricaAlbaniaArgentinaArmeniaAsiaAustraliaAustriaBahamasBangladeshBarbadosBelarusBelgiumBelizeBoliviaBosnia and HerzegovinaBrazilBulgariaBurma/MyanmarCabo VerdeCambodiaCameroonCanadaCaribbeanCentral AmericaChileChinaColombiaCongoCosta RicaCroatiaCubaCzechoslovakiaDenmarkDominicaDominican RepublicEastern AfricaEastern AsiaEastern EuropeEcuadorEgyptEl SalvadorEnglandEritreaEthiopiaEuropeFijiFranceGermanyGhanaGreeceGrenadaGuatemalaGuyanaHaitiHondurasHong KongHungaryIndiaIndonesiaIranIraqIrelandIsraelItalyJamaicaJapanJordanKazakhstanKenyaKoreaKuwaitLaosLatin AmericaLatviaLebanonLiberiaLithuaniaMalaysiaMexicoMicronesiaMiddle AfricaMoldovaMoroccoNepalNetherlandsNicaraguaNigeriaNorth AmericaNorth MacedoniaNorthern AfricaNorthern EuropeNorwayOceaniaPakistanPanamaPeruPhilippinesPolandPortugalRomaniaRussiaSaudi ArabiaScotlandSenegalSerbiaSierra LeoneSingaporeSomaliaSouth AfricaSouth AmericaSouth Central AsiaSouth Eastern AsiaSouthern EuropeSpainSri LankaSt. Vincent and the GrenadinesSudanSwedenSwitzerlandSyriaTaiwanThailandTrinidad and TobagoTurkeyUgandaUkraineUruguayUzbekistanVenezuelaWest IndiesWestern AfricaWestern AsiaWestern EuropeYemenZaireZimbabweAzores
Immigrants from Vietnam
Race
Ancestry
AfghanAfricanAlaska NativeAlaskan AthabascanAlbanianAleutAlsatianAmericanApacheArabArapahoArgentineanArmenianAssyrian/Chaldean/SyriacAustralianAustrianBahamianBangladeshiBarbadianBasqueBelgianBelizeanBermudanBhutaneseBlackfeetBolivianBrazilianBritishBritish West IndianBulgarianBurmeseCajunCambodianCanadianCape VerdeanCarpatho RusynCelticCentral AmericanCentral American IndianCherokeeCheyenneChickasawChileanChineseChippewaChoctawColombianColvilleComancheCosta RicanCreeCreekCroatianCrowCubanCypriotCzechCzechoslovakianDanishDelawareDominicanDutchDutch West IndianEastern EuropeanEcuadorianEgyptianEnglishEstonianEthiopianEuropeanFijianFilipinoFinnishFrenchFrench American IndianFrench CanadianGermanGerman RussianGhanaianGreekGuamanian/ChamorroGuatemalanGuyaneseHaitianHmongHonduranHopiHoumaHungarianIcelanderIndian (Asian)IndonesianInupiatIranianIraqiIrishIroquoisIsraeliItalianJamaicanJapaneseJordanianKenyanKiowaKoreanLaotianLatvianLebaneseLiberianLithuanianLumbeeLuxembourgerMacedonianMalaysianMalteseMarshalleseMenomineeMexicanMexican American IndianMongolianMoroccanNative HawaiianNavajoNepaleseNew ZealanderNicaraguanNigerianNorthern EuropeanNorwegianOkinawanOsageOttawaPaiutePakistaniPalestinianPanamanianParaguayanPennsylvania GermanPeruvianPimaPolishPortuguesePotawatomiPuebloPuerto RicanPuget Sound SalishRomanianRussianSalvadoranSamoanScandinavianScotch-IrishScottishSeminoleSenegaleseSerbianShoshoneSierra LeoneanSiouxSlavicSlovakSloveneSomaliSouth AfricanSouth AmericanSouth American IndianSoviet UnionSpaniardSpanishSpanish AmericanSpanish American IndianSri LankanSubsaharan AfricanSudaneseSwedishSwissSyrianTaiwaneseThaiTlingit-HaidaTohono O'OdhamTonganTrinidadian and TobagonianTsimshianTurkishU.S. Virgin IslanderUgandanUkrainianUruguayanUteVenezuelanWelshWest IndianYakamaYaquiYugoslavianYumanYup'ikZimbabwean
Immigration
NonimmigrantsImmigrantsAfghanistanAfricaAlbaniaArgentinaArmeniaAsiaAustraliaAustriaBahamasBangladeshBarbadosBelarusBelgiumBelizeBoliviaBosnia and HerzegovinaBrazilBulgariaBurma/MyanmarCabo VerdeCambodiaCameroonCanadaCaribbeanCentral AmericaChileChinaColombiaCongoCosta RicaCroatiaCubaCzechoslovakiaDenmarkDominicaDominican RepublicEastern AfricaEastern AsiaEastern EuropeEcuadorEgyptEl SalvadorEnglandEritreaEthiopiaEuropeFijiFranceGermanyGhanaGreeceGrenadaGuatemalaGuyanaHaitiHondurasHong KongHungaryIndiaIndonesiaIranIraqIrelandIsraelItalyJamaicaJapanJordanKazakhstanKenyaKoreaKuwaitLaosLatin AmericaLatviaLebanonLiberiaLithuaniaMalaysiaMexicoMicronesiaMiddle AfricaMoldovaMoroccoNepalNetherlandsNicaraguaNigeriaNorth AmericaNorth MacedoniaNorthern AfricaNorthern EuropeNorwayOceaniaPakistanPanamaPeruPhilippinesPolandPortugalRomaniaRussiaSaudi ArabiaScotlandSenegalSerbiaSierra LeoneSingaporeSomaliaSouth AfricaSouth AmericaSouth Central AsiaSouth Eastern AsiaSouthern EuropeSpainSri LankaSt. Vincent and the GrenadinesSudanSwedenSwitzerlandSyriaTaiwanThailandTrinidad and TobagoTurkeyUgandaUkraineUruguayUzbekistanVenezuelaVietnamWest IndiesWestern AfricaWestern AsiaWestern EuropeYemenZaireZimbabweAzores
Family Poverty
Income
Poverty
Unemployment
Labor Participation
Family Structure
Vehicle Availability
Education Level
Disability

Family Poverty Comparison

Vietnamese

Immigrants from Vietnam

Tragic
Good
11.5%
FAMILY POVERTY
0.0/ 100
METRIC RATING
287th/ 347
METRIC RANK
8.7%
FAMILY POVERTY
75.4/ 100
METRIC RATING
154th/ 347
METRIC RANK

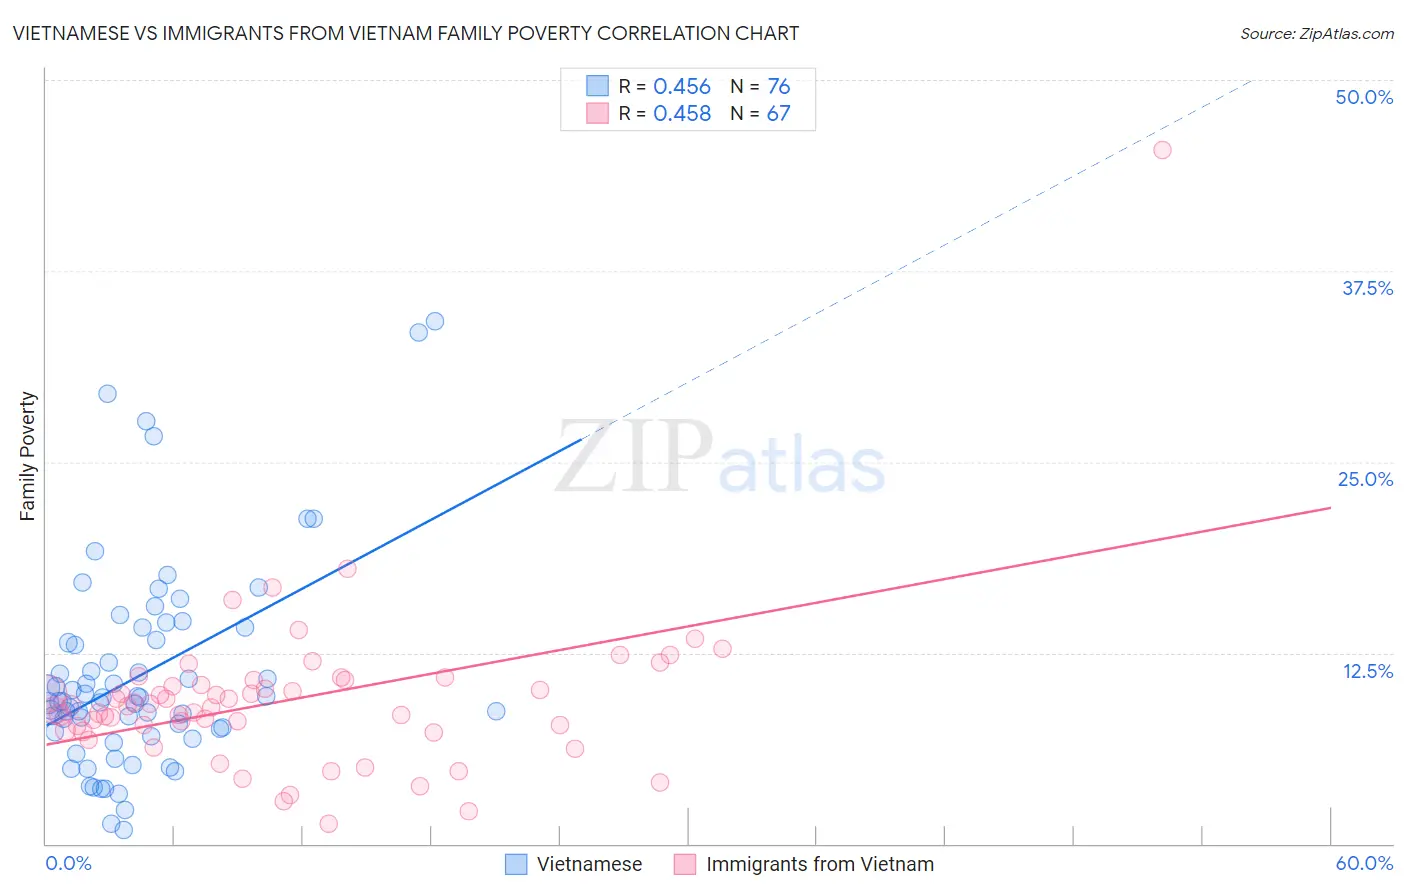
Vietnamese vs Immigrants from Vietnam Family Poverty Correlation Chart

The statistical analysis conducted on geographies consisting of 170,550,296 people shows a moderate positive correlation between the proportion of Vietnamese and poverty level among families in the United States with a correlation coefficient (R) of 0.456 and weighted average of 11.5%. Similarly, the statistical analysis conducted on geographies consisting of 403,957,519 people shows a moderate positive correlation between the proportion of Immigrants from Vietnam and poverty level among families in the United States with a correlation coefficient (R) of 0.458 and weighted average of 8.7%, a difference of 32.5%.
Vietnamese vs Immigrants from Vietnam Family Poverty

Family Poverty Correlation Summary

MeasurementVietnameseImmigrants from Vietnam
Minimum0.88%1.3%
Maximum34.2%45.5%
Range33.4%44.1%
Mean11.1%9.4%
Median9.4%9.0%
Interquartile 25% (IQ1)7.4%7.4%
Interquartile 75% (IQ3)13.7%10.7%
Interquartile Range (IQR)6.3%3.3%
Standard Deviation (Sample)6.8%5.5%
Standard Deviation (Population)6.7%5.5%

Similar Demographics by Family Poverty

Demographics Similar to Vietnamese by Family Poverty

In terms of family poverty, the demographic groups most similar to Vietnamese are Immigrants from Belize (11.5%, a difference of 0.19%), Immigrants from Barbados (11.5%, a difference of 0.24%), West Indian (11.5%, a difference of 0.25%), Senegalese (11.5%, a difference of 0.27%), and Haitian (11.5%, a difference of 0.31%).
DemographicsRating | RankFamily Poverty
Belizeans
0.0
/100
|
#280
Tragic
11.3%
Immigrants | West Indies
0.0
/100
|
#281
Tragic
11.3%
Immigrants | Cuba
0.0
/100
|
#282
Tragic
11.3%
Indonesians
0.0
/100
|
#283
Tragic
11.3%
Yaqui
0.0
/100
|
#284
Tragic
11.3%
Barbadians
0.0
/100
|
#285
Tragic
11.3%
Senegalese
0.0
/100
|
#286
Tragic
11.5%
Vietnamese
0.0
/100
|
#287
Tragic
11.5%
Immigrants | Belize
0.0
/100
|
#288
Tragic
11.5%
Immigrants | Barbados
0.0
/100
|
#289
Tragic
11.5%
West Indians
0.0
/100
|
#290
Tragic
11.5%
Haitians
0.0
/100
|
#291
Tragic
11.5%
Immigrants | Somalia
0.0
/100
|
#292
Tragic
11.5%
Immigrants | Cabo Verde
0.0
/100
|
#293
Tragic
11.6%
Immigrants | St. Vincent and the Grenadines
0.0
/100
|
#294
Tragic
11.6%

Demographics Similar to Immigrants from Vietnam by Family Poverty

In terms of family poverty, the demographic groups most similar to Immigrants from Vietnam are Immigrants from Kuwait (8.7%, a difference of 0.33%), Immigrants from Spain (8.6%, a difference of 0.72%), Immigrants from Oceania (8.7%, a difference of 0.74%), Samoan (8.6%, a difference of 0.86%), and Brazilian (8.6%, a difference of 0.94%).
DemographicsRating | RankFamily Poverty
Immigrants | Jordan
83.0
/100
|
#147
Excellent
8.5%
Scotch-Irish
82.2
/100
|
#148
Excellent
8.6%
Mongolians
80.4
/100
|
#149
Excellent
8.6%
Syrians
80.3
/100
|
#150
Excellent
8.6%
Brazilians
80.1
/100
|
#151
Excellent
8.6%
Samoans
79.8
/100
|
#152
Good
8.6%
Immigrants | Spain
79.1
/100
|
#153
Good
8.6%
Immigrants | Vietnam
75.4
/100
|
#154
Good
8.7%
Immigrants | Kuwait
73.6
/100
|
#155
Good
8.7%
Immigrants | Oceania
71.2
/100
|
#156
Good
8.7%
Tsimshian
69.3
/100
|
#157
Good
8.8%
Whites/Caucasians
69.1
/100
|
#158
Good
8.8%
Peruvians
68.0
/100
|
#159
Good
8.8%
Hungarians
67.2
/100
|
#160
Good
8.8%
Immigrants | Northern Africa
66.9
/100
|
#161
Good
8.8%