Venezuelan vs Immigrants from England Child Poverty Under the Age of 16
COMPARE
Venezuelan
Immigrants from England
Child Poverty Under the Age of 16
Child Poverty Under the Age of 16 Comparison
Venezuelans
Immigrants from England
15.6%
CHILD POVERTY UNDER THE AGE OF 16
77.4/ 100
METRIC RATING
153rd/ 347
METRIC RANK
14.8%
CHILD POVERTY UNDER THE AGE OF 16
94.8/ 100
METRIC RATING
104th/ 347
METRIC RANK
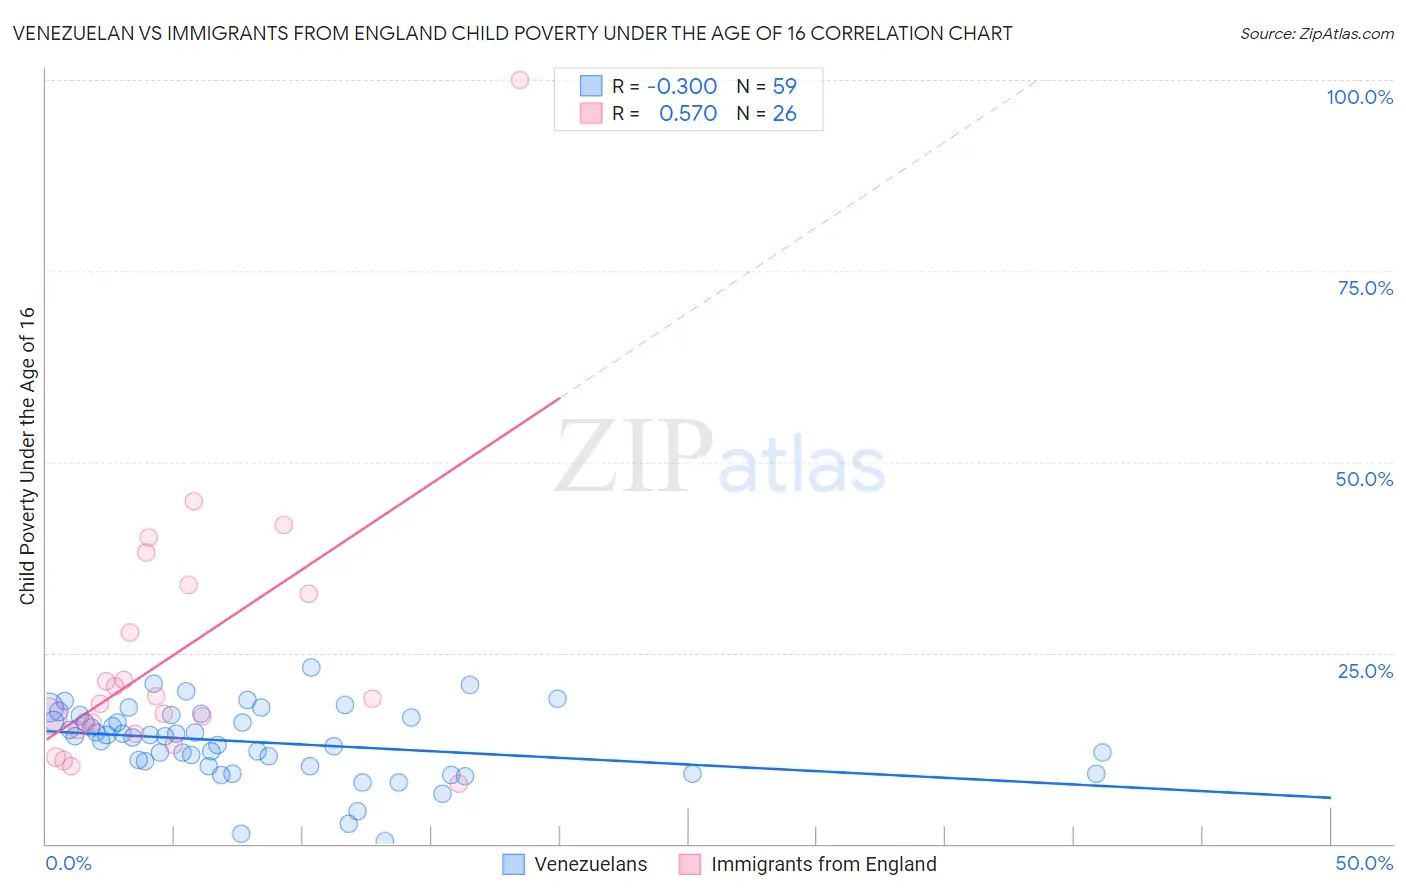
Venezuelan vs Immigrants from England Child Poverty Under the Age of 16 Correlation Chart
The statistical analysis conducted on geographies consisting of 304,499,680 people shows a weak negative correlation between the proportion of Venezuelans and poverty level among children under the age of 16 in the United States with a correlation coefficient (R) of -0.300 and weighted average of 15.6%. Similarly, the statistical analysis conducted on geographies consisting of 387,672,551 people shows a substantial positive correlation between the proportion of Immigrants from England and poverty level among children under the age of 16 in the United States with a correlation coefficient (R) of 0.570 and weighted average of 14.8%, a difference of 5.5%.
Child Poverty Under the Age of 16 Correlation Summary
| Measurement | Venezuelan | Immigrants from England |
| Minimum | 0.32% | 7.8% |
| Maximum | 23.1% | 100.0% |
| Range | 22.8% | 92.2% |
| Mean | 13.3% | 24.7% |
| Median | 14.2% | 18.6% |
| Interquartile 25% (IQ1) | 10.1% | 14.9% |
| Interquartile 75% (IQ3) | 16.8% | 32.7% |
| Interquartile Range (IQR) | 6.7% | 17.8% |
| Standard Deviation (Sample) | 4.8% | 18.6% |
| Standard Deviation (Population) | 4.7% | 18.2% |
Similar Demographics by Child Poverty Under the Age of 16
Demographics Similar to Venezuelans by Child Poverty Under the Age of 16
In terms of child poverty under the age of 16, the demographic groups most similar to Venezuelans are Samoan (15.6%, a difference of 0.030%), French Canadian (15.6%, a difference of 0.15%), French (15.6%, a difference of 0.18%), Immigrants from Jordan (15.6%, a difference of 0.19%), and Syrian (15.6%, a difference of 0.24%).
| Demographics | Rating | Rank | Child Poverty Under the Age of 16 |
| Slovaks | 81.4 /100 | #146 | Excellent 15.5% |
| Immigrants | Kuwait | 80.5 /100 | #147 | Excellent 15.5% |
| Puget Sound Salish | 80.3 /100 | #148 | Excellent 15.5% |
| Israelis | 80.1 /100 | #149 | Excellent 15.5% |
| Immigrants | Jordan | 78.5 /100 | #150 | Good 15.6% |
| French | 78.5 /100 | #151 | Good 15.6% |
| French Canadians | 78.2 /100 | #152 | Good 15.6% |
| Venezuelans | 77.4 /100 | #153 | Good 15.6% |
| Samoans | 77.3 /100 | #154 | Good 15.6% |
| Syrians | 76.1 /100 | #155 | Good 15.6% |
| Immigrants | Venezuela | 74.9 /100 | #156 | Good 15.7% |
| Immigrants | Nepal | 72.9 /100 | #157 | Good 15.7% |
| Immigrants | Chile | 72.8 /100 | #158 | Good 15.7% |
| Immigrants | Fiji | 71.1 /100 | #159 | Good 15.8% |
| Immigrants | Albania | 70.7 /100 | #160 | Good 15.8% |
Demographics Similar to Immigrants from England by Child Poverty Under the Age of 16
In terms of child poverty under the age of 16, the demographic groups most similar to Immigrants from England are Immigrants from Egypt (14.8%, a difference of 0.040%), Romanian (14.8%, a difference of 0.090%), Basque (14.8%, a difference of 0.11%), Immigrants from Switzerland (14.8%, a difference of 0.16%), and Dutch (14.8%, a difference of 0.17%).
| Demographics | Rating | Rank | Child Poverty Under the Age of 16 |
| Paraguayans | 95.7 /100 | #97 | Exceptional 14.7% |
| Immigrants | Belarus | 95.7 /100 | #98 | Exceptional 14.7% |
| British | 95.5 /100 | #99 | Exceptional 14.7% |
| Dutch | 95.1 /100 | #100 | Exceptional 14.8% |
| Immigrants | Switzerland | 95.1 /100 | #101 | Exceptional 14.8% |
| Romanians | 95.0 /100 | #102 | Exceptional 14.8% |
| Immigrants | Egypt | 94.9 /100 | #103 | Exceptional 14.8% |
| Immigrants | England | 94.8 /100 | #104 | Exceptional 14.8% |
| Basques | 94.7 /100 | #105 | Exceptional 14.8% |
| Serbians | 94.5 /100 | #106 | Exceptional 14.8% |
| Chileans | 94.4 /100 | #107 | Exceptional 14.8% |
| Jordanians | 94.2 /100 | #108 | Exceptional 14.8% |
| Tlingit-Haida | 94.1 /100 | #109 | Exceptional 14.9% |
| English | 93.5 /100 | #110 | Exceptional 14.9% |
| Immigrants | Denmark | 93.5 /100 | #111 | Exceptional 14.9% |