Ute vs Immigrants from Bahamas Child Poverty Among Boys Under 16
COMPARE
Ute
Immigrants from Bahamas
Child Poverty Among Boys Under 16
Child Poverty Among Boys Under 16 Comparison
Ute
Immigrants from Bahamas
21.6%
CHILD POVERTY AMONG BOYS UNDER 16
0.0/ 100
METRIC RATING
314th/ 347
METRIC RANK
20.7%
CHILD POVERTY AMONG BOYS UNDER 16
0.0/ 100
METRIC RATING
294th/ 347
METRIC RANK
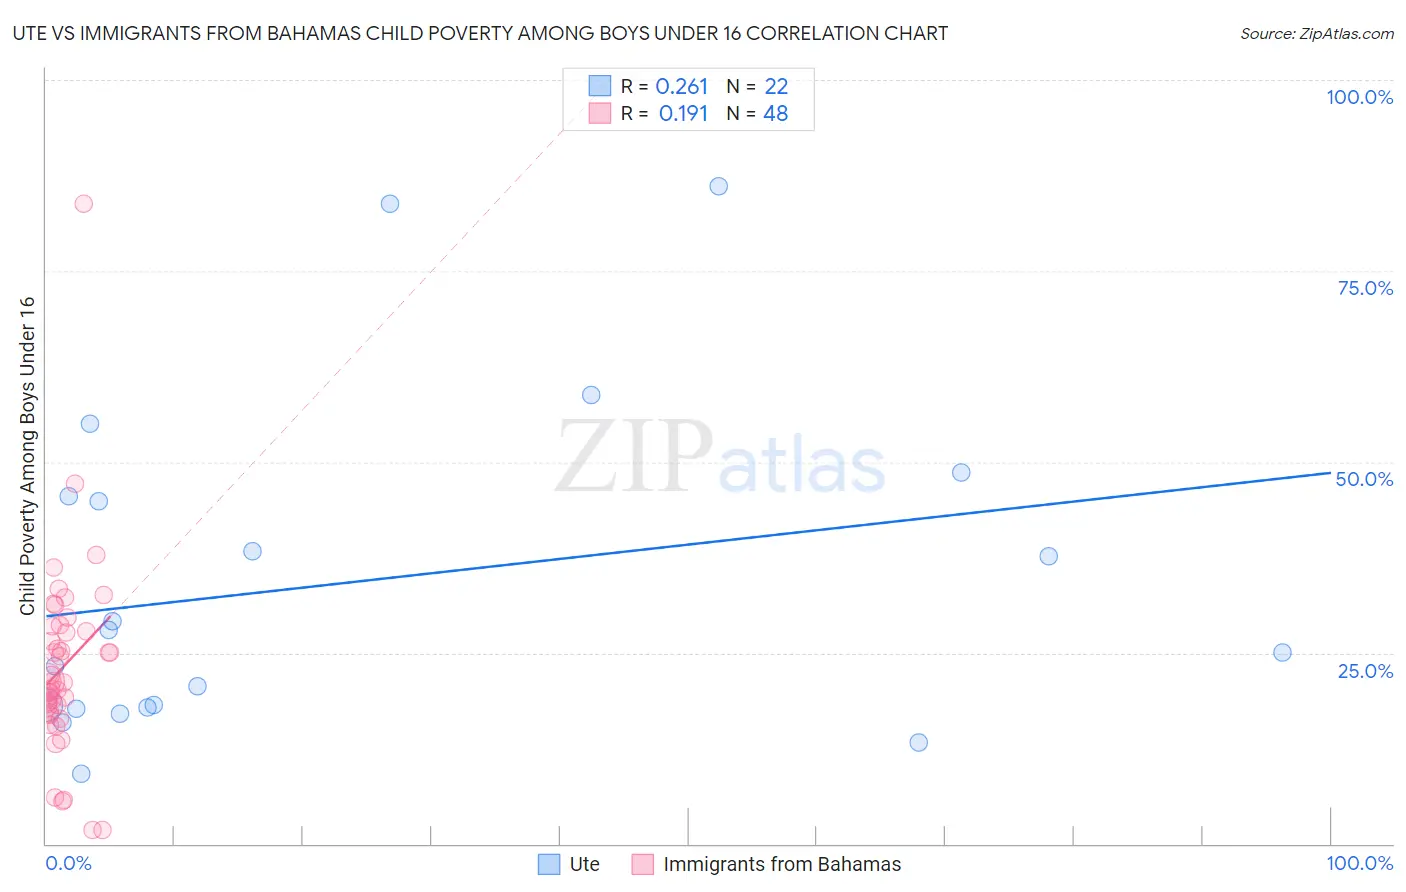
Ute vs Immigrants from Bahamas Child Poverty Among Boys Under 16 Correlation Chart
The statistical analysis conducted on geographies consisting of 55,537,245 people shows a weak positive correlation between the proportion of Ute and poverty level among boys under the age of 16 in the United States with a correlation coefficient (R) of 0.261 and weighted average of 21.6%. Similarly, the statistical analysis conducted on geographies consisting of 104,324,399 people shows a poor positive correlation between the proportion of Immigrants from Bahamas and poverty level among boys under the age of 16 in the United States with a correlation coefficient (R) of 0.191 and weighted average of 20.7%, a difference of 4.2%.
Child Poverty Among Boys Under 16 Correlation Summary
| Measurement | Ute | Immigrants from Bahamas |
| Minimum | 9.2% | 1.7% |
| Maximum | 86.0% | 83.9% |
| Range | 76.9% | 82.1% |
| Mean | 34.2% | 23.1% |
| Median | 26.5% | 21.2% |
| Interquartile 25% (IQ1) | 17.8% | 17.6% |
| Interquartile 75% (IQ3) | 45.5% | 28.2% |
| Interquartile Range (IQR) | 27.7% | 10.6% |
| Standard Deviation (Sample) | 21.7% | 12.8% |
| Standard Deviation (Population) | 21.2% | 12.6% |
Demographics Similar to Ute and Immigrants from Bahamas by Child Poverty Among Boys Under 16
In terms of child poverty among boys under 16, the demographic groups most similar to Ute are British West Indian (21.6%, a difference of 0.010%), Immigrants from Guatemala (21.6%, a difference of 0.020%), Bahamian (21.6%, a difference of 0.10%), Creek (21.5%, a difference of 0.21%), and Seminole (21.5%, a difference of 0.27%). Similarly, the demographic groups most similar to Immigrants from Bahamas are Mexican (20.7%, a difference of 0.13%), Indonesian (20.8%, a difference of 0.32%), Hispanic or Latino (20.9%, a difference of 0.93%), Chippewa (21.0%, a difference of 1.2%), and Immigrants from Caribbean (21.0%, a difference of 1.5%).
| Demographics | Rating | Rank | Child Poverty Among Boys Under 16 |
| Immigrants | Bahamas | 0.0 /100 | #294 | Tragic 20.7% |
| Mexicans | 0.0 /100 | #295 | Tragic 20.7% |
| Indonesians | 0.0 /100 | #296 | Tragic 20.8% |
| Hispanics or Latinos | 0.0 /100 | #297 | Tragic 20.9% |
| Chippewa | 0.0 /100 | #298 | Tragic 21.0% |
| Immigrants | Caribbean | 0.0 /100 | #299 | Tragic 21.0% |
| Haitians | 0.0 /100 | #300 | Tragic 21.0% |
| Guatemalans | 0.0 /100 | #301 | Tragic 21.1% |
| Somalis | 0.0 /100 | #302 | Tragic 21.1% |
| Immigrants | Haiti | 0.0 /100 | #303 | Tragic 21.3% |
| Immigrants | Central America | 0.0 /100 | #304 | Tragic 21.3% |
| Kiowa | 0.0 /100 | #305 | Tragic 21.3% |
| Immigrants | Grenada | 0.0 /100 | #306 | Tragic 21.3% |
| Choctaw | 0.0 /100 | #307 | Tragic 21.3% |
| Immigrants | Mexico | 0.0 /100 | #308 | Tragic 21.5% |
| Seminole | 0.0 /100 | #309 | Tragic 21.5% |
| Creek | 0.0 /100 | #310 | Tragic 21.5% |
| Bahamians | 0.0 /100 | #311 | Tragic 21.6% |
| Immigrants | Guatemala | 0.0 /100 | #312 | Tragic 21.6% |
| British West Indians | 0.0 /100 | #313 | Tragic 21.6% |
| Ute | 0.0 /100 | #314 | Tragic 21.6% |