Ute vs Eastern European Single Male Poverty
COMPARE
Ute
Eastern European
Single Male Poverty
Single Male Poverty Comparison
Ute
Eastern Europeans
15.7%
SINGLE MALE POVERTY
0.0/ 100
METRIC RATING
307th/ 347
METRIC RANK
12.7%
SINGLE MALE POVERTY
63.3/ 100
METRIC RATING
162nd/ 347
METRIC RANK
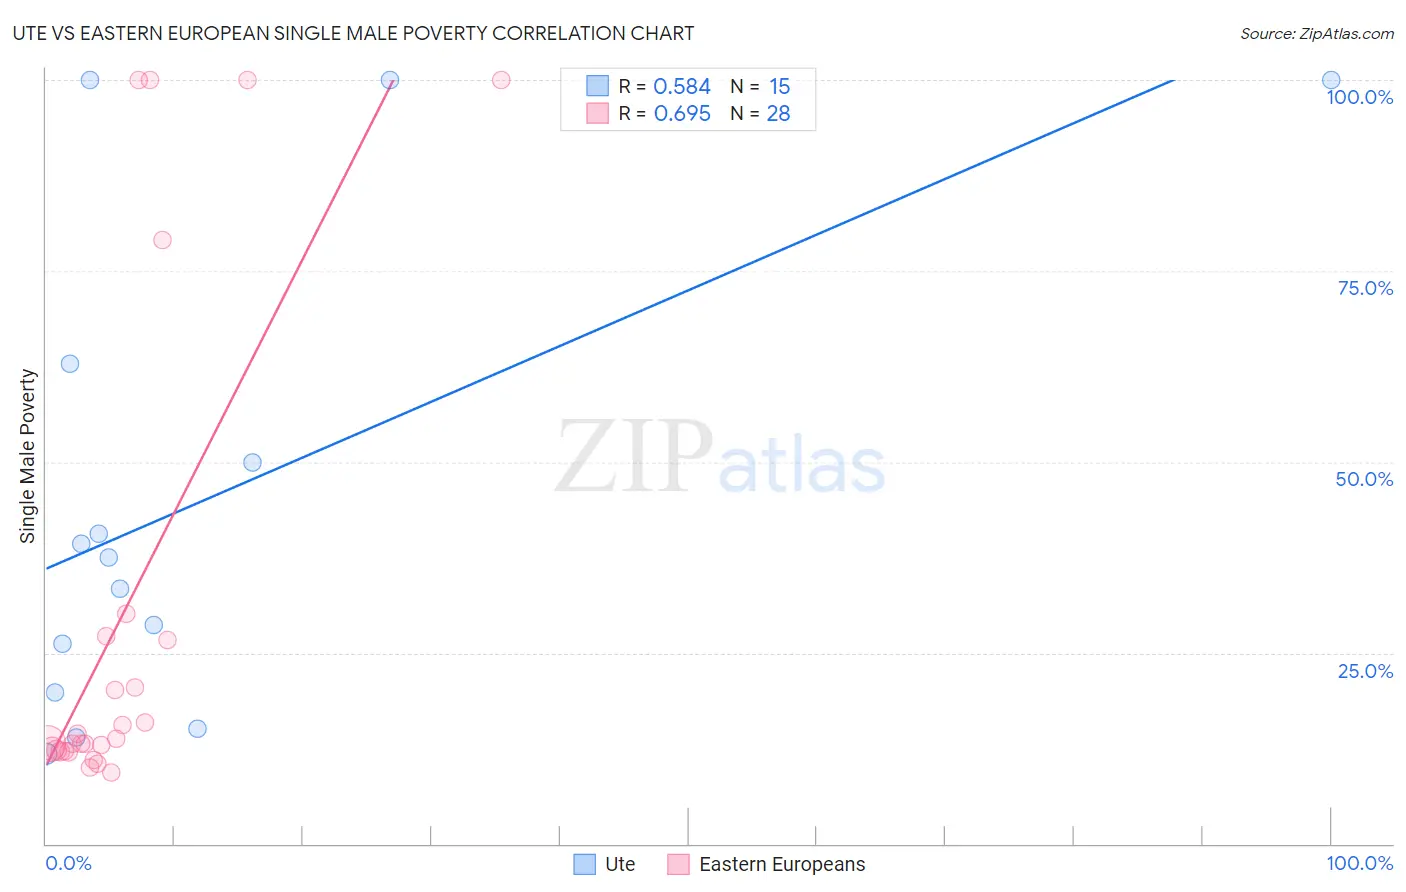
Ute vs Eastern European Single Male Poverty Correlation Chart
The statistical analysis conducted on geographies consisting of 54,243,903 people shows a substantial positive correlation between the proportion of Ute and poverty level among single males in the United States with a correlation coefficient (R) of 0.584 and weighted average of 15.7%. Similarly, the statistical analysis conducted on geographies consisting of 394,365,623 people shows a significant positive correlation between the proportion of Eastern Europeans and poverty level among single males in the United States with a correlation coefficient (R) of 0.695 and weighted average of 12.7%, a difference of 23.4%.
Single Male Poverty Correlation Summary
| Measurement | Ute | Eastern European |
| Minimum | 11.8% | 9.4% |
| Maximum | 100.0% | 100.0% |
| Range | 88.2% | 90.6% |
| Mean | 45.2% | 29.6% |
| Median | 37.4% | 13.5% |
| Interquartile 25% (IQ1) | 19.9% | 12.2% |
| Interquartile 75% (IQ3) | 62.8% | 26.9% |
| Interquartile Range (IQR) | 42.9% | 14.7% |
| Standard Deviation (Sample) | 31.5% | 32.0% |
| Standard Deviation (Population) | 30.4% | 31.5% |
Similar Demographics by Single Male Poverty
Demographics Similar to Ute by Single Male Poverty
In terms of single male poverty, the demographic groups most similar to Ute are Potawatomi (15.8%, a difference of 0.57%), American (15.8%, a difference of 0.73%), Pennsylvania German (15.6%, a difference of 0.75%), Blackfeet (15.5%, a difference of 1.2%), and Yakama (15.9%, a difference of 1.6%).
| Demographics | Rating | Rank | Single Male Poverty |
| Cree | 0.0 /100 | #300 | Tragic 15.1% |
| Dominicans | 0.0 /100 | #301 | Tragic 15.2% |
| Alsatians | 0.0 /100 | #302 | Tragic 15.2% |
| Aleuts | 0.0 /100 | #303 | Tragic 15.4% |
| Alaska Natives | 0.0 /100 | #304 | Tragic 15.4% |
| Blackfeet | 0.0 /100 | #305 | Tragic 15.5% |
| Pennsylvania Germans | 0.0 /100 | #306 | Tragic 15.6% |
| Ute | 0.0 /100 | #307 | Tragic 15.7% |
| Potawatomi | 0.0 /100 | #308 | Tragic 15.8% |
| Americans | 0.0 /100 | #309 | Tragic 15.8% |
| Yakama | 0.0 /100 | #310 | Tragic 15.9% |
| Seminole | 0.0 /100 | #311 | Tragic 16.0% |
| Comanche | 0.0 /100 | #312 | Tragic 16.0% |
| Cherokee | 0.0 /100 | #313 | Tragic 16.1% |
| Alaskan Athabascans | 0.0 /100 | #314 | Tragic 16.1% |
Demographics Similar to Eastern Europeans by Single Male Poverty
In terms of single male poverty, the demographic groups most similar to Eastern Europeans are Immigrants from Africa (12.7%, a difference of 0.010%), Palestinian (12.7%, a difference of 0.010%), Immigrants from Nigeria (12.7%, a difference of 0.020%), Immigrants from Liberia (12.7%, a difference of 0.050%), and Greek (12.7%, a difference of 0.050%).
| Demographics | Rating | Rank | Single Male Poverty |
| Immigrants | Spain | 68.7 /100 | #155 | Good 12.7% |
| Vietnamese | 67.9 /100 | #156 | Good 12.7% |
| Latvians | 67.9 /100 | #157 | Good 12.7% |
| Immigrants | Middle Africa | 64.9 /100 | #158 | Good 12.7% |
| Immigrants | Liberia | 64.2 /100 | #159 | Good 12.7% |
| Greeks | 64.1 /100 | #160 | Good 12.7% |
| Immigrants | Africa | 63.4 /100 | #161 | Good 12.7% |
| Eastern Europeans | 63.3 /100 | #162 | Good 12.7% |
| Palestinians | 63.1 /100 | #163 | Good 12.7% |
| Immigrants | Nigeria | 62.8 /100 | #164 | Good 12.7% |
| Immigrants | Cambodia | 62.2 /100 | #165 | Good 12.7% |
| Immigrants | Guyana | 60.5 /100 | #166 | Good 12.7% |
| Immigrants | Sudan | 58.2 /100 | #167 | Average 12.7% |
| Immigrants | Barbados | 57.7 /100 | #168 | Average 12.7% |
| Puget Sound Salish | 54.3 /100 | #169 | Average 12.8% |