Uruguayan vs Immigrants from Syria Child Poverty Under the Age of 16
COMPARE
Uruguayan
Immigrants from Syria
Child Poverty Under the Age of 16
Child Poverty Under the Age of 16 Comparison
Uruguayans
Immigrants from Syria
16.1%
CHILD POVERTY UNDER THE AGE OF 16
54.7/ 100
METRIC RATING
169th/ 347
METRIC RANK
16.4%
CHILD POVERTY UNDER THE AGE OF 16
42.3/ 100
METRIC RATING
179th/ 347
METRIC RANK
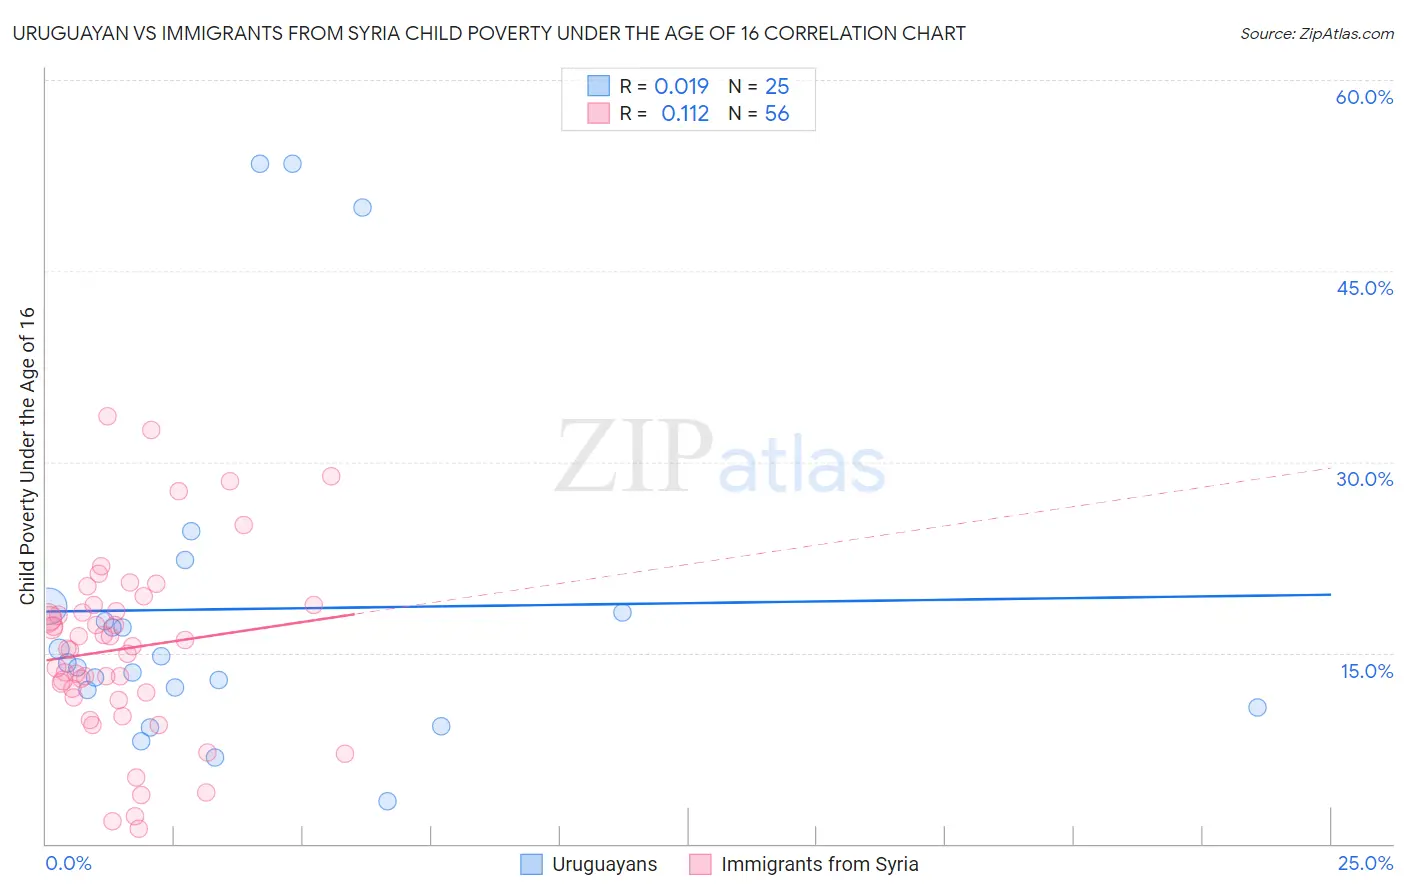
Uruguayan vs Immigrants from Syria Child Poverty Under the Age of 16 Correlation Chart
The statistical analysis conducted on geographies consisting of 144,396,450 people shows no correlation between the proportion of Uruguayans and poverty level among children under the age of 16 in the United States with a correlation coefficient (R) of 0.019 and weighted average of 16.1%. Similarly, the statistical analysis conducted on geographies consisting of 173,660,467 people shows a poor positive correlation between the proportion of Immigrants from Syria and poverty level among children under the age of 16 in the United States with a correlation coefficient (R) of 0.112 and weighted average of 16.4%, a difference of 1.5%.
Child Poverty Under the Age of 16 Correlation Summary
| Measurement | Uruguayan | Immigrants from Syria |
| Minimum | 3.3% | 1.2% |
| Maximum | 53.4% | 33.6% |
| Range | 50.1% | 32.4% |
| Mean | 18.4% | 15.3% |
| Median | 14.2% | 15.4% |
| Interquartile 25% (IQ1) | 11.4% | 11.7% |
| Interquartile 75% (IQ3) | 18.4% | 18.5% |
| Interquartile Range (IQR) | 7.0% | 6.8% |
| Standard Deviation (Sample) | 13.6% | 7.1% |
| Standard Deviation (Population) | 13.3% | 7.0% |
Demographics Similar to Uruguayans and Immigrants from Syria by Child Poverty Under the Age of 16
In terms of child poverty under the age of 16, the demographic groups most similar to Uruguayans are Immigrants from Colombia (16.1%, a difference of 0.040%), Hungarian (16.2%, a difference of 0.27%), Afghan (16.2%, a difference of 0.29%), Immigrants from Saudi Arabia (16.2%, a difference of 0.31%), and South American (16.0%, a difference of 0.40%). Similarly, the demographic groups most similar to Immigrants from Syria are Immigrants from Ethiopia (16.4%, a difference of 0.0%), South American Indian (16.4%, a difference of 0.050%), Ethiopian (16.3%, a difference of 0.13%), Immigrants from South America (16.4%, a difference of 0.18%), and Lebanese (16.3%, a difference of 0.43%).
| Demographics | Rating | Rank | Child Poverty Under the Age of 16 |
| Immigrants | Germany | 67.3 /100 | #164 | Good 15.8% |
| Guamanians/Chamorros | 66.4 /100 | #165 | Good 15.9% |
| Immigrants | Oceania | 65.4 /100 | #166 | Good 15.9% |
| Costa Ricans | 61.1 /100 | #167 | Good 16.0% |
| South Americans | 57.9 /100 | #168 | Average 16.0% |
| Uruguayans | 54.7 /100 | #169 | Average 16.1% |
| Immigrants | Colombia | 54.4 /100 | #170 | Average 16.1% |
| Hungarians | 52.5 /100 | #171 | Average 16.2% |
| Afghans | 52.3 /100 | #172 | Average 16.2% |
| Immigrants | Saudi Arabia | 52.1 /100 | #173 | Average 16.2% |
| Whites/Caucasians | 50.0 /100 | #174 | Average 16.2% |
| Scotch-Irish | 47.1 /100 | #175 | Average 16.3% |
| Lebanese | 45.9 /100 | #176 | Average 16.3% |
| Ethiopians | 43.4 /100 | #177 | Average 16.3% |
| Immigrants | Ethiopia | 42.3 /100 | #178 | Average 16.4% |
| Immigrants | Syria | 42.3 /100 | #179 | Average 16.4% |
| South American Indians | 41.8 /100 | #180 | Average 16.4% |
| Immigrants | South America | 40.8 /100 | #181 | Average 16.4% |
| Hawaiians | 38.2 /100 | #182 | Fair 16.4% |
| Celtics | 38.2 /100 | #183 | Fair 16.4% |
| Immigrants | Western Asia | 38.0 /100 | #184 | Fair 16.4% |