Uruguayan vs Bhutanese Seniors Poverty Over the Age of 75
COMPARE
Uruguayan
Bhutanese
Seniors Poverty Over the Age of 75
Seniors Poverty Over the Age of 75 Comparison
Uruguayans
Bhutanese
13.5%
SENIORS POVERTY OVER THE AGE OF 75
0.5/ 100
METRIC RATING
245th/ 347
METRIC RANK
10.6%
SENIORS POVERTY OVER THE AGE OF 75
99.8/ 100
METRIC RATING
22nd/ 347
METRIC RANK
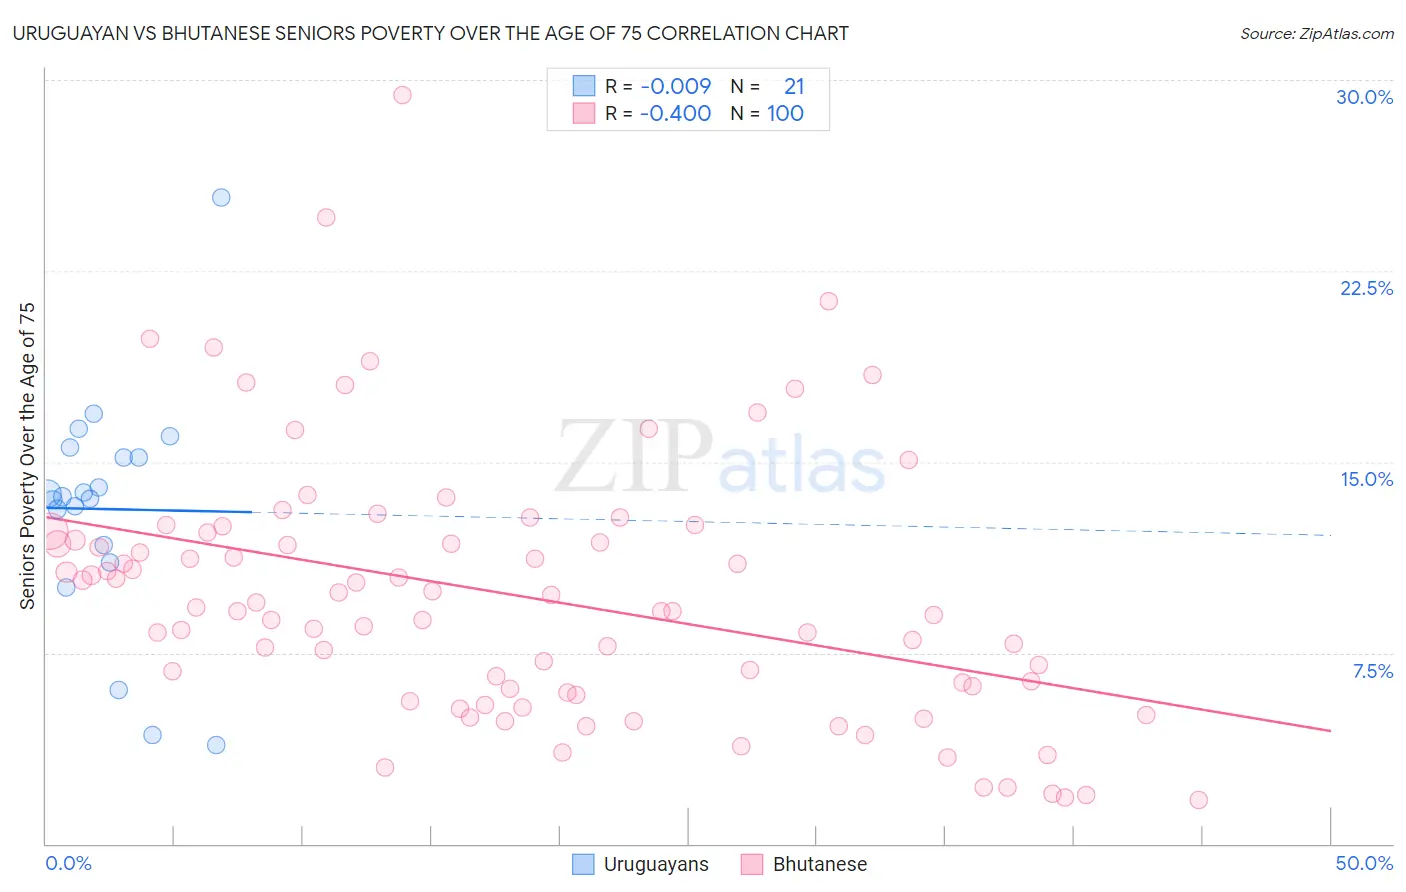
Uruguayan vs Bhutanese Seniors Poverty Over the Age of 75 Correlation Chart
The statistical analysis conducted on geographies consisting of 144,212,472 people shows no correlation between the proportion of Uruguayans and poverty level among seniors over the age of 75 in the United States with a correlation coefficient (R) of -0.009 and weighted average of 13.5%. Similarly, the statistical analysis conducted on geographies consisting of 448,170,245 people shows a mild negative correlation between the proportion of Bhutanese and poverty level among seniors over the age of 75 in the United States with a correlation coefficient (R) of -0.400 and weighted average of 10.6%, a difference of 27.8%.
Seniors Poverty Over the Age of 75 Correlation Summary
| Measurement | Uruguayan | Bhutanese |
| Minimum | 3.9% | 1.7% |
| Maximum | 25.4% | 29.4% |
| Range | 21.5% | 27.7% |
| Mean | 13.1% | 9.8% |
| Median | 13.6% | 9.2% |
| Interquartile 25% (IQ1) | 11.4% | 6.0% |
| Interquartile 75% (IQ3) | 15.4% | 12.1% |
| Interquartile Range (IQR) | 4.0% | 6.1% |
| Standard Deviation (Sample) | 4.6% | 5.1% |
| Standard Deviation (Population) | 4.5% | 5.1% |
Similar Demographics by Seniors Poverty Over the Age of 75
Demographics Similar to Uruguayans by Seniors Poverty Over the Age of 75
In terms of seniors poverty over the age of 75, the demographic groups most similar to Uruguayans are Spanish American (13.5%, a difference of 0.14%), Immigrants from Cambodia (13.6%, a difference of 0.23%), Dutch West Indian (13.5%, a difference of 0.46%), Immigrants from Somalia (13.5%, a difference of 0.48%), and Immigrants from Russia (13.4%, a difference of 0.58%).
| Demographics | Rating | Rank | Seniors Poverty Over the Age of 75 |
| Peruvians | 0.8 /100 | #238 | Tragic 13.4% |
| Panamanians | 0.8 /100 | #239 | Tragic 13.4% |
| Argentineans | 0.7 /100 | #240 | Tragic 13.4% |
| Immigrants | Russia | 0.6 /100 | #241 | Tragic 13.4% |
| Immigrants | Somalia | 0.6 /100 | #242 | Tragic 13.5% |
| Dutch West Indians | 0.6 /100 | #243 | Tragic 13.5% |
| Spanish Americans | 0.5 /100 | #244 | Tragic 13.5% |
| Uruguayans | 0.5 /100 | #245 | Tragic 13.5% |
| Immigrants | Cambodia | 0.4 /100 | #246 | Tragic 13.6% |
| Immigrants | Ukraine | 0.3 /100 | #247 | Tragic 13.6% |
| Africans | 0.3 /100 | #248 | Tragic 13.6% |
| Immigrants | Albania | 0.3 /100 | #249 | Tragic 13.6% |
| Mexican American Indians | 0.3 /100 | #250 | Tragic 13.6% |
| Immigrants | Peru | 0.3 /100 | #251 | Tragic 13.7% |
| Immigrants | Argentina | 0.3 /100 | #252 | Tragic 13.7% |
Demographics Similar to Bhutanese by Seniors Poverty Over the Age of 75
In terms of seniors poverty over the age of 75, the demographic groups most similar to Bhutanese are Lithuanian (10.6%, a difference of 0.020%), Polish (10.6%, a difference of 0.090%), Menominee (10.6%, a difference of 0.11%), Slovene (10.6%, a difference of 0.26%), and Czech (10.5%, a difference of 0.30%).
| Demographics | Rating | Rank | Seniors Poverty Over the Age of 75 |
| Europeans | 99.9 /100 | #15 | Exceptional 10.5% |
| Dutch | 99.9 /100 | #16 | Exceptional 10.5% |
| Slovaks | 99.9 /100 | #17 | Exceptional 10.5% |
| Welsh | 99.9 /100 | #18 | Exceptional 10.5% |
| Immigrants | Scotland | 99.9 /100 | #19 | Exceptional 10.5% |
| Czechs | 99.9 /100 | #20 | Exceptional 10.5% |
| Slovenes | 99.9 /100 | #21 | Exceptional 10.6% |
| Bhutanese | 99.8 /100 | #22 | Exceptional 10.6% |
| Lithuanians | 99.8 /100 | #23 | Exceptional 10.6% |
| Poles | 99.8 /100 | #24 | Exceptional 10.6% |
| Menominee | 99.8 /100 | #25 | Exceptional 10.6% |
| Bulgarians | 99.8 /100 | #26 | Exceptional 10.7% |
| Northern Europeans | 99.8 /100 | #27 | Exceptional 10.7% |
| Irish | 99.8 /100 | #28 | Exceptional 10.7% |
| Assyrians/Chaldeans/Syriacs | 99.8 /100 | #29 | Exceptional 10.7% |