Ukrainian vs Immigrants from Cameroon Female Poverty Among 18-24 Year Olds
COMPARE
Ukrainian
Immigrants from Cameroon
Female Poverty Among 18-24 Year Olds
Female Poverty Among 18-24 Year Olds Comparison
Ukrainians
Immigrants from Cameroon
19.0%
FEMALE POVERTY AMONG 18-24 YEAR OLDS
98.8/ 100
METRIC RATING
94th/ 347
METRIC RANK
19.3%
FEMALE POVERTY AMONG 18-24 YEAR OLDS
96.3/ 100
METRIC RATING
113th/ 347
METRIC RANK
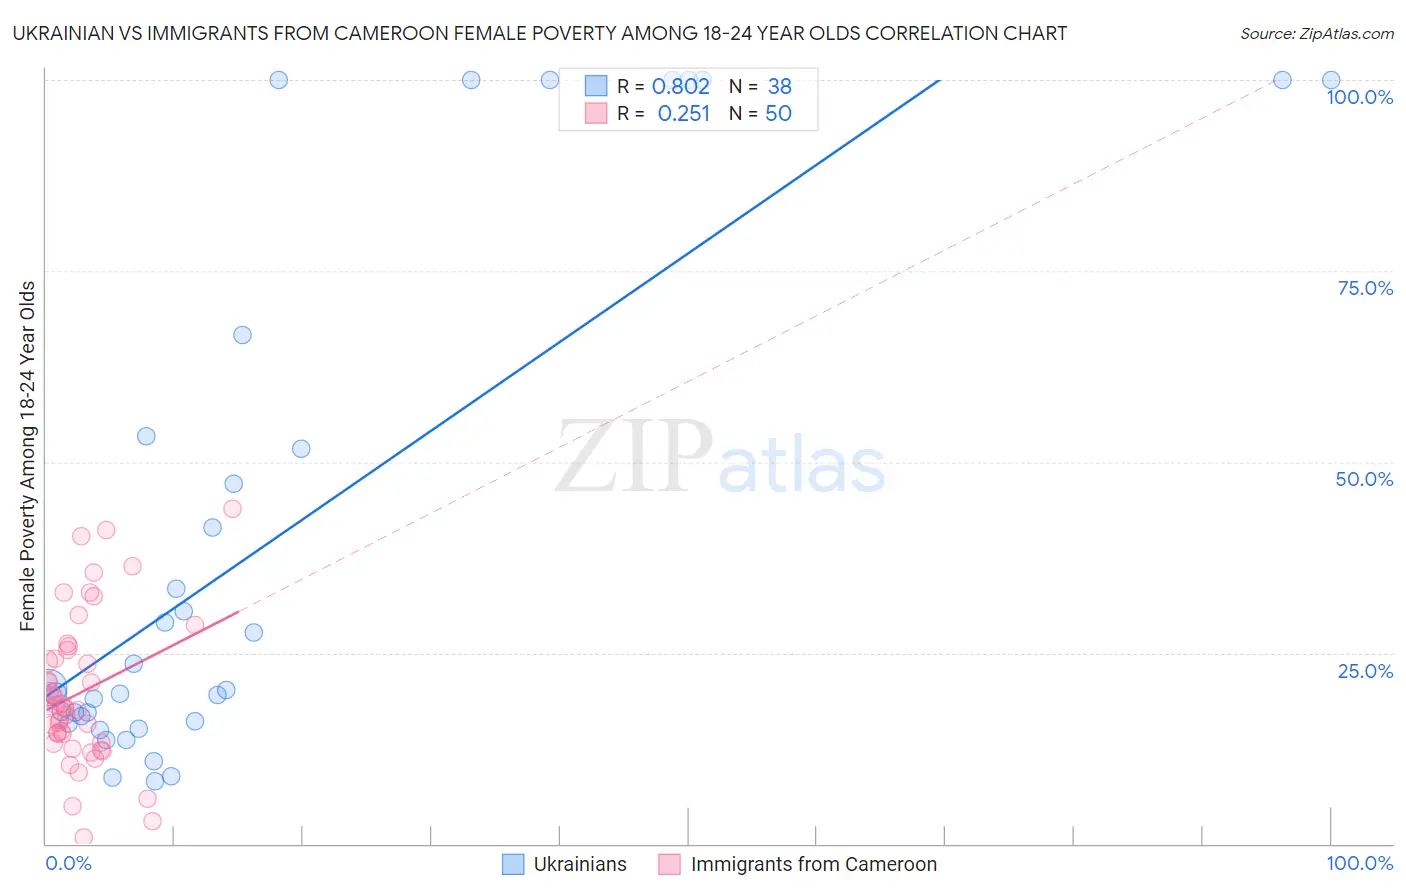
Ukrainian vs Immigrants from Cameroon Female Poverty Among 18-24 Year Olds Correlation Chart
The statistical analysis conducted on geographies consisting of 430,534,121 people shows a very strong positive correlation between the proportion of Ukrainians and poverty level among females between the ages 18 and 24 in the United States with a correlation coefficient (R) of 0.802 and weighted average of 19.0%. Similarly, the statistical analysis conducted on geographies consisting of 129,816,473 people shows a weak positive correlation between the proportion of Immigrants from Cameroon and poverty level among females between the ages 18 and 24 in the United States with a correlation coefficient (R) of 0.251 and weighted average of 19.3%, a difference of 1.5%.
Female Poverty Among 18-24 Year Olds Correlation Summary
| Measurement | Ukrainian | Immigrants from Cameroon |
| Minimum | 8.2% | 0.87% |
| Maximum | 100.0% | 43.9% |
| Range | 91.8% | 43.1% |
| Mean | 39.9% | 19.8% |
| Median | 20.4% | 18.0% |
| Interquartile 25% (IQ1) | 16.1% | 13.2% |
| Interquartile 75% (IQ3) | 53.4% | 25.4% |
| Interquartile Range (IQR) | 37.3% | 12.2% |
| Standard Deviation (Sample) | 34.0% | 9.8% |
| Standard Deviation (Population) | 33.5% | 9.7% |
Demographics Similar to Ukrainians and Immigrants from Cameroon by Female Poverty Among 18-24 Year Olds
In terms of female poverty among 18-24 year olds, the demographic groups most similar to Ukrainians are Haitian (19.0%, a difference of 0.060%), Guamanian/Chamorro (19.0%, a difference of 0.070%), Sierra Leonean (19.0%, a difference of 0.17%), Salvadoran (19.1%, a difference of 0.43%), and Immigrants from Jordan (19.1%, a difference of 0.44%). Similarly, the demographic groups most similar to Immigrants from Cameroon are Immigrants from El Salvador (19.3%, a difference of 0.060%), Immigrants from Serbia (19.2%, a difference of 0.29%), Laotian (19.2%, a difference of 0.31%), Immigrants from Syria (19.2%, a difference of 0.33%), and Immigrants from Uzbekistan (19.2%, a difference of 0.41%).
| Demographics | Rating | Rank | Female Poverty Among 18-24 Year Olds |
| Haitians | 98.9 /100 | #93 | Exceptional 19.0% |
| Ukrainians | 98.8 /100 | #94 | Exceptional 19.0% |
| Guamanians/Chamorros | 98.8 /100 | #95 | Exceptional 19.0% |
| Sierra Leoneans | 98.7 /100 | #96 | Exceptional 19.0% |
| Salvadorans | 98.4 /100 | #97 | Exceptional 19.1% |
| Immigrants | Jordan | 98.4 /100 | #98 | Exceptional 19.1% |
| Immigrants | Czechoslovakia | 98.3 /100 | #99 | Exceptional 19.1% |
| Chileans | 98.3 /100 | #100 | Exceptional 19.1% |
| Ecuadorians | 98.1 /100 | #101 | Exceptional 19.1% |
| Immigrants | Caribbean | 98.1 /100 | #102 | Exceptional 19.1% |
| Serbians | 98.0 /100 | #103 | Exceptional 19.1% |
| Immigrants | Afghanistan | 98.0 /100 | #104 | Exceptional 19.1% |
| Immigrants | Ecuador | 97.8 /100 | #105 | Exceptional 19.2% |
| Immigrants | Sierra Leone | 97.8 /100 | #106 | Exceptional 19.2% |
| Immigrants | Sri Lanka | 97.5 /100 | #107 | Exceptional 19.2% |
| Immigrants | Uzbekistan | 97.3 /100 | #108 | Exceptional 19.2% |
| Immigrants | Syria | 97.2 /100 | #109 | Exceptional 19.2% |
| Laotians | 97.1 /100 | #110 | Exceptional 19.2% |
| Immigrants | Serbia | 97.1 /100 | #111 | Exceptional 19.2% |
| Immigrants | El Salvador | 96.5 /100 | #112 | Exceptional 19.3% |
| Immigrants | Cameroon | 96.3 /100 | #113 | Exceptional 19.3% |