Ugandan vs Finnish Child Poverty Among Boys Under 16

COMPARE

Ugandan
Race
Ancestry
AfghanAfricanAlaska NativeAlaskan AthabascanAlbanianAleutAlsatianAmericanApacheArabArapahoArgentineanArmenianAssyrian/Chaldean/SyriacAustralianAustrianBahamianBangladeshiBarbadianBasqueBelgianBelizeanBermudanBhutaneseBlackfeetBolivianBrazilianBritishBritish West IndianBulgarianBurmeseCajunCambodianCanadianCape VerdeanCarpatho RusynCelticCentral AmericanCentral American IndianCherokeeCheyenneChickasawChileanChineseChippewaChoctawColombianColvilleComancheCosta RicanCreeCreekCroatianCrowCubanCypriotCzechCzechoslovakianDanishDelawareDominicanDutchDutch West IndianEastern EuropeanEcuadorianEgyptianEnglishEstonianEthiopianEuropeanFijianFilipinoFrenchFrench American IndianFrench CanadianGermanGerman RussianGhanaianGreekGuamanian/ChamorroGuatemalanGuyaneseHaitianHmongHonduranHopiHoumaHungarianIcelanderIndian (Asian)IndonesianInupiatIranianIraqiIrishIroquoisIsraeliItalianJamaicanJapaneseJordanianKenyanKiowaKoreanLaotianLatvianLebaneseLiberianLithuanianLumbeeLuxembourgerMacedonianMalaysianMalteseMarshalleseMenomineeMexicanMexican American IndianMongolianMoroccanNative HawaiianNavajoNepaleseNew ZealanderNicaraguanNigerianNorthern EuropeanNorwegianOkinawanOsageOttawaPaiutePakistaniPalestinianPanamanianParaguayanPennsylvania GermanPeruvianPimaPolishPortuguesePotawatomiPuebloPuerto RicanPuget Sound SalishRomanianRussianSalvadoranSamoanScandinavianScotch-IrishScottishSeminoleSenegaleseSerbianShoshoneSierra LeoneanSiouxSlavicSlovakSloveneSomaliSouth AfricanSouth AmericanSouth American IndianSoviet UnionSpaniardSpanishSpanish AmericanSpanish American IndianSri LankanSubsaharan AfricanSudaneseSwedishSwissSyrianTaiwaneseThaiTlingit-HaidaTohono O'OdhamTonganTrinidadian and TobagonianTsimshianTurkishU.S. Virgin IslanderUgandanUkrainianUruguayanUteVenezuelanVietnameseWelshWest IndianYakamaYaquiYugoslavianYumanYup'ikZimbabwean
Immigration
NonimmigrantsImmigrantsAfghanistanAfricaAlbaniaArgentinaArmeniaAsiaAustraliaAustriaBahamasBangladeshBarbadosBelarusBelgiumBelizeBoliviaBosnia and HerzegovinaBrazilBulgariaBurma/MyanmarCabo VerdeCambodiaCameroonCanadaCaribbeanCentral AmericaChileChinaColombiaCongoCosta RicaCroatiaCubaCzechoslovakiaDenmarkDominicaDominican RepublicEastern AfricaEastern AsiaEastern EuropeEcuadorEgyptEl SalvadorEnglandEritreaEthiopiaEuropeFijiFranceGermanyGhanaGreeceGrenadaGuatemalaGuyanaHaitiHondurasHong KongHungaryIndiaIndonesiaIranIraqIrelandIsraelItalyJamaicaJapanJordanKazakhstanKenyaKoreaKuwaitLaosLatin AmericaLatviaLebanonLiberiaLithuaniaMalaysiaMexicoMicronesiaMiddle AfricaMoldovaMoroccoNepalNetherlandsNicaraguaNigeriaNorth AmericaNorth MacedoniaNorthern AfricaNorthern EuropeNorwayOceaniaPakistanPanamaPeruPhilippinesPolandPortugalRomaniaRussiaSaudi ArabiaScotlandSenegalSerbiaSierra LeoneSingaporeSomaliaSouth AfricaSouth AmericaSouth Central AsiaSouth Eastern AsiaSouthern EuropeSpainSri LankaSt. Vincent and the GrenadinesSudanSwedenSwitzerlandSyriaTaiwanThailandTrinidad and TobagoTurkeyUgandaUkraineUruguayUzbekistanVenezuelaVietnamWest IndiesWestern AfricaWestern AsiaWestern EuropeYemenZaireZimbabweAzores
Finnish
Race
Ancestry
AfghanAfricanAlaska NativeAlaskan AthabascanAlbanianAleutAlsatianAmericanApacheArabArapahoArgentineanArmenianAssyrian/Chaldean/SyriacAustralianAustrianBahamianBangladeshiBarbadianBasqueBelgianBelizeanBermudanBhutaneseBlackfeetBolivianBrazilianBritishBritish West IndianBulgarianBurmeseCajunCambodianCanadianCape VerdeanCarpatho RusynCelticCentral AmericanCentral American IndianCherokeeCheyenneChickasawChileanChineseChippewaChoctawColombianColvilleComancheCosta RicanCreeCreekCroatianCrowCubanCypriotCzechCzechoslovakianDanishDelawareDominicanDutchDutch West IndianEastern EuropeanEcuadorianEgyptianEnglishEstonianEthiopianEuropeanFijianFilipinoFinnishFrenchFrench American IndianFrench CanadianGermanGerman RussianGhanaianGreekGuamanian/ChamorroGuatemalanGuyaneseHaitianHmongHonduranHopiHoumaHungarianIcelanderIndian (Asian)IndonesianInupiatIranianIraqiIrishIroquoisIsraeliItalianJamaicanJapaneseJordanianKenyanKiowaKoreanLaotianLatvianLebaneseLiberianLithuanianLumbeeLuxembourgerMacedonianMalaysianMalteseMarshalleseMenomineeMexicanMexican American IndianMongolianMoroccanNative HawaiianNavajoNepaleseNew ZealanderNicaraguanNigerianNorthern EuropeanNorwegianOkinawanOsageOttawaPaiutePakistaniPalestinianPanamanianParaguayanPennsylvania GermanPeruvianPimaPolishPortuguesePotawatomiPuebloPuerto RicanPuget Sound SalishRomanianRussianSalvadoranSamoanScandinavianScotch-IrishScottishSeminoleSenegaleseSerbianShoshoneSierra LeoneanSiouxSlavicSlovakSloveneSomaliSouth AfricanSouth AmericanSouth American IndianSoviet UnionSpaniardSpanishSpanish AmericanSpanish American IndianSri LankanSubsaharan AfricanSudaneseSwedishSwissSyrianTaiwaneseThaiTlingit-HaidaTohono O'OdhamTonganTrinidadian and TobagonianTsimshianTurkishU.S. Virgin IslanderUkrainianUruguayanUteVenezuelanVietnameseWelshWest IndianYakamaYaquiYugoslavianYumanYup'ikZimbabwean
Immigration
NonimmigrantsImmigrantsAfghanistanAfricaAlbaniaArgentinaArmeniaAsiaAustraliaAustriaBahamasBangladeshBarbadosBelarusBelgiumBelizeBoliviaBosnia and HerzegovinaBrazilBulgariaBurma/MyanmarCabo VerdeCambodiaCameroonCanadaCaribbeanCentral AmericaChileChinaColombiaCongoCosta RicaCroatiaCubaCzechoslovakiaDenmarkDominicaDominican RepublicEastern AfricaEastern AsiaEastern EuropeEcuadorEgyptEl SalvadorEnglandEritreaEthiopiaEuropeFijiFranceGermanyGhanaGreeceGrenadaGuatemalaGuyanaHaitiHondurasHong KongHungaryIndiaIndonesiaIranIraqIrelandIsraelItalyJamaicaJapanJordanKazakhstanKenyaKoreaKuwaitLaosLatin AmericaLatviaLebanonLiberiaLithuaniaMalaysiaMexicoMicronesiaMiddle AfricaMoldovaMoroccoNepalNetherlandsNicaraguaNigeriaNorth AmericaNorth MacedoniaNorthern AfricaNorthern EuropeNorwayOceaniaPakistanPanamaPeruPhilippinesPolandPortugalRomaniaRussiaSaudi ArabiaScotlandSenegalSerbiaSierra LeoneSingaporeSomaliaSouth AfricaSouth AmericaSouth Central AsiaSouth Eastern AsiaSouthern EuropeSpainSri LankaSt. Vincent and the GrenadinesSudanSwedenSwitzerlandSyriaTaiwanThailandTrinidad and TobagoTurkeyUgandaUkraineUruguayUzbekistanVenezuelaVietnamWest IndiesWestern AfricaWestern AsiaWestern EuropeYemenZaireZimbabweAzores
Child Poverty Among Boys Under 16
Income
Poverty
Unemployment
Labor Participation
Family Structure
Vehicle Availability
Education Level
Disability

Child Poverty Among Boys Under 16 Comparison

Ugandans

Finns

Poor
Exceptional
17.3%
CHILD POVERTY AMONG BOYS UNDER 16
12.5/ 100
METRIC RATING
204th/ 347
METRIC RANK
14.9%
CHILD POVERTY AMONG BOYS UNDER 16
96.5/ 100
METRIC RATING
95th/ 347
METRIC RANK

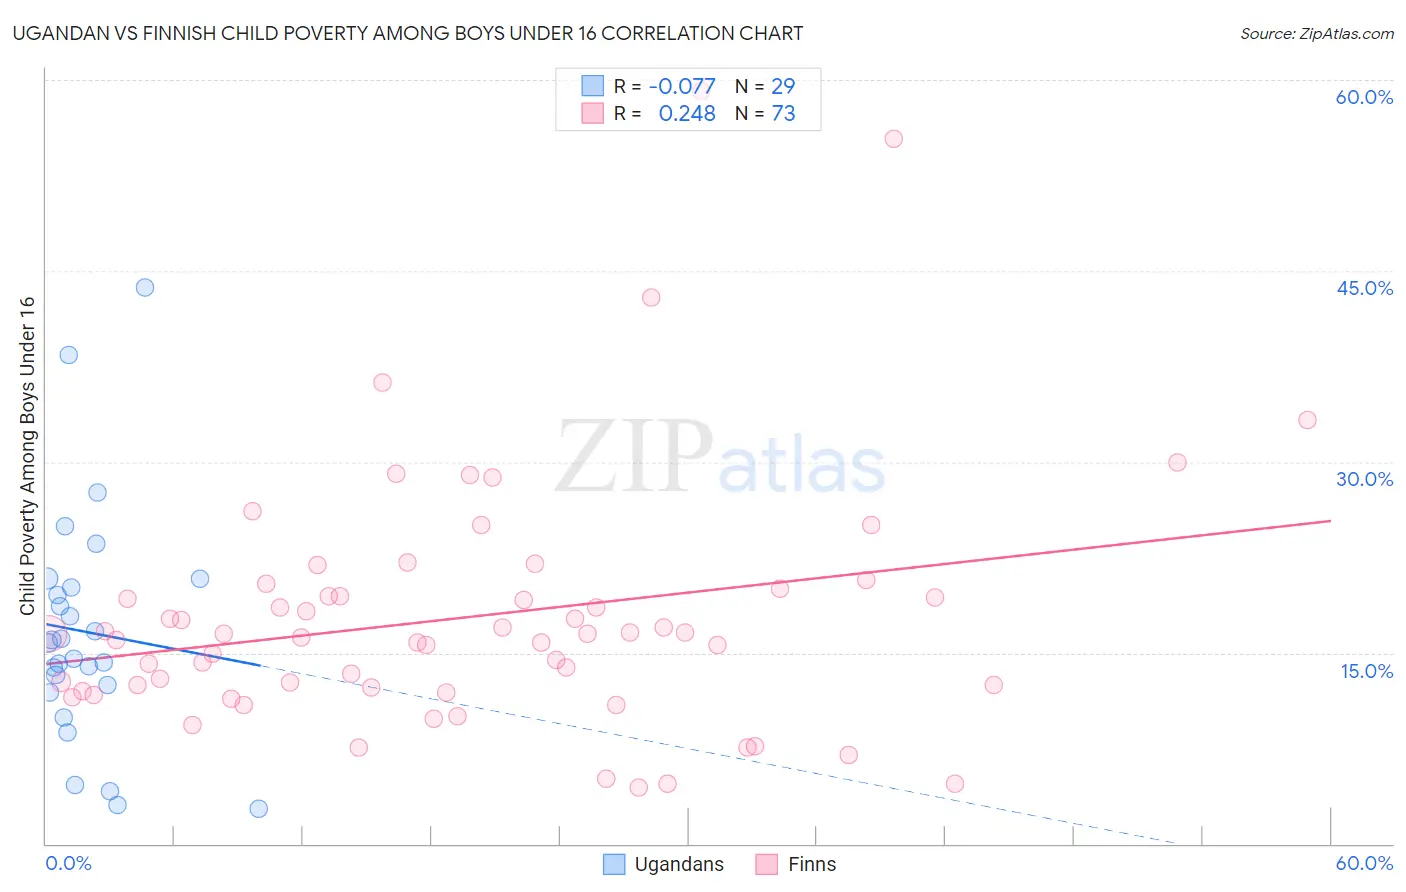
Ugandan vs Finnish Child Poverty Among Boys Under 16 Correlation Chart

The statistical analysis conducted on geographies consisting of 93,708,162 people shows a slight negative correlation between the proportion of Ugandans and poverty level among boys under the age of 16 in the United States with a correlation coefficient (R) of -0.077 and weighted average of 17.3%. Similarly, the statistical analysis conducted on geographies consisting of 396,043,937 people shows a weak positive correlation between the proportion of Finns and poverty level among boys under the age of 16 in the United States with a correlation coefficient (R) of 0.248 and weighted average of 14.9%, a difference of 16.3%.
Ugandan vs Finnish Child Poverty Among Boys Under 16

Child Poverty Among Boys Under 16 Correlation Summary

MeasurementUgandanFinnish
Minimum2.8%4.4%
Maximum43.7%59.2%
Range41.0%54.8%
Mean16.6%17.8%
Median15.8%16.5%
Interquartile 25% (IQ1)12.2%12.1%
Interquartile 75% (IQ3)20.5%19.7%
Interquartile Range (IQR)8.3%7.6%
Standard Deviation (Sample)9.2%9.9%
Standard Deviation (Population)9.1%9.8%

Similar Demographics by Child Poverty Among Boys Under 16

Demographics Similar to Ugandans by Child Poverty Among Boys Under 16

In terms of child poverty among boys under 16, the demographic groups most similar to Ugandans are Immigrants from Uzbekistan (17.3%, a difference of 0.20%), Immigrants from Sierra Leone (17.3%, a difference of 0.22%), Immigrants from Afghanistan (17.3%, a difference of 0.28%), Immigrants from Portugal (17.4%, a difference of 0.33%), and German Russian (17.4%, a difference of 0.39%).
DemographicsRating | RankChild Poverty Among Boys Under 16
Immigrants | Kenya
20.1
/100
|
#197
Fair
17.1%
Immigrants | Cameroon
19.0
/100
|
#198
Poor
17.1%
Delaware
18.8
/100
|
#199
Poor
17.1%
Immigrants | Uruguay
16.9
/100
|
#200
Poor
17.2%
Immigrants | Afghanistan
13.7
/100
|
#201
Poor
17.3%
Immigrants | Sierra Leone
13.4
/100
|
#202
Poor
17.3%
Immigrants | Uzbekistan
13.3
/100
|
#203
Poor
17.3%
Ugandans
12.5
/100
|
#204
Poor
17.3%
Immigrants | Portugal
11.2
/100
|
#205
Poor
17.4%
German Russians
10.9
/100
|
#206
Poor
17.4%
Immigrants | Thailand
8.2
/100
|
#207
Tragic
17.5%
Malaysians
7.6
/100
|
#208
Tragic
17.6%
Alaskan Athabascans
7.3
/100
|
#209
Tragic
17.6%
Immigrants | Armenia
6.8
/100
|
#210
Tragic
17.6%
Immigrants | Immigrants
6.7
/100
|
#211
Tragic
17.6%

Demographics Similar to Finns by Child Poverty Among Boys Under 16

In terms of child poverty among boys under 16, the demographic groups most similar to Finns are Immigrants from Italy (14.9%, a difference of 0.10%), Sri Lankan (14.9%, a difference of 0.11%), Argentinean (14.9%, a difference of 0.16%), Paraguayan (14.9%, a difference of 0.23%), and Immigrants from North Macedonia (14.9%, a difference of 0.25%).
DemographicsRating | RankChild Poverty Among Boys Under 16
Immigrants | North America
97.1
/100
|
#88
Exceptional
14.8%
Immigrants | Argentina
97.1
/100
|
#89
Exceptional
14.8%
Austrians
97.1
/100
|
#90
Exceptional
14.8%
Paraguayans
96.8
/100
|
#91
Exceptional
14.9%
Argentineans
96.7
/100
|
#92
Exceptional
14.9%
Sri Lankans
96.7
/100
|
#93
Exceptional
14.9%
Immigrants | Italy
96.7
/100
|
#94
Exceptional
14.9%
Finns
96.5
/100
|
#95
Exceptional
14.9%
Immigrants | North Macedonia
96.3
/100
|
#96
Exceptional
14.9%
Immigrants | Egypt
96.2
/100
|
#97
Exceptional
14.9%
British
96.2
/100
|
#98
Exceptional
15.0%
Immigrants | France
96.1
/100
|
#99
Exceptional
15.0%
Chileans
95.8
/100
|
#100
Exceptional
15.0%
Immigrants | Belarus
95.7
/100
|
#101
Exceptional
15.0%
Romanians
95.6
/100
|
#102
Exceptional
15.0%