Tsimshian vs Immigrants from Switzerland Seniors Poverty Over the Age of 75
COMPARE
Tsimshian
Immigrants from Switzerland
Seniors Poverty Over the Age of 75
Seniors Poverty Over the Age of 75 Comparison
Tsimshian
Immigrants from Switzerland
16.1%
SENIORS POVERTY OVER THE AGE OF 75
0.0/ 100
METRIC RATING
314th/ 347
METRIC RANK
12.1%
SENIORS POVERTY OVER THE AGE OF 75
54.5/ 100
METRIC RATING
167th/ 347
METRIC RANK
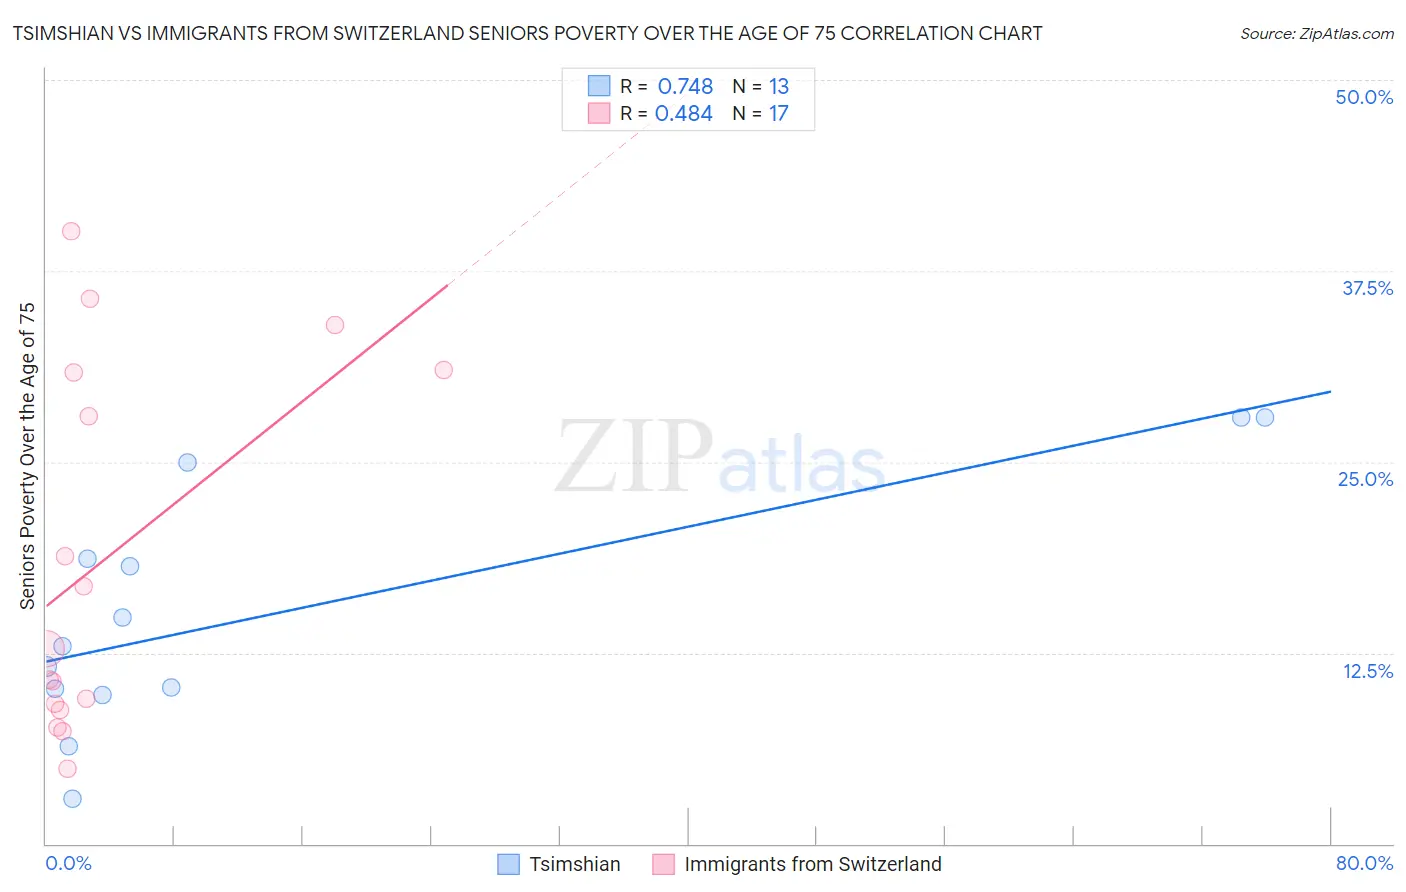
Tsimshian vs Immigrants from Switzerland Seniors Poverty Over the Age of 75 Correlation Chart
The statistical analysis conducted on geographies consisting of 15,602,839 people shows a strong positive correlation between the proportion of Tsimshian and poverty level among seniors over the age of 75 in the United States with a correlation coefficient (R) of 0.748 and weighted average of 16.1%. Similarly, the statistical analysis conducted on geographies consisting of 147,293,011 people shows a moderate positive correlation between the proportion of Immigrants from Switzerland and poverty level among seniors over the age of 75 in the United States with a correlation coefficient (R) of 0.484 and weighted average of 12.1%, a difference of 32.4%.
Seniors Poverty Over the Age of 75 Correlation Summary
| Measurement | Tsimshian | Immigrants from Switzerland |
| Minimum | 3.0% | 4.9% |
| Maximum | 27.9% | 40.1% |
| Range | 25.0% | 35.2% |
| Mean | 15.1% | 18.6% |
| Median | 12.9% | 12.8% |
| Interquartile 25% (IQ1) | 9.9% | 9.0% |
| Interquartile 75% (IQ3) | 21.8% | 31.0% |
| Interquartile Range (IQR) | 11.9% | 22.0% |
| Standard Deviation (Sample) | 8.0% | 11.9% |
| Standard Deviation (Population) | 7.7% | 11.5% |
Similar Demographics by Seniors Poverty Over the Age of 75
Demographics Similar to Tsimshian by Seniors Poverty Over the Age of 75
In terms of seniors poverty over the age of 75, the demographic groups most similar to Tsimshian are Guyanese (16.1%, a difference of 0.30%), Immigrants from Ecuador (16.1%, a difference of 0.31%), Barbadian (16.0%, a difference of 0.35%), Crow (15.9%, a difference of 0.83%), and Immigrants from Guyana (16.2%, a difference of 0.93%).
| Demographics | Rating | Rank | Seniors Poverty Over the Age of 75 |
| Immigrants | West Indies | 0.0 /100 | #307 | Tragic 15.8% |
| Immigrants | Bangladesh | 0.0 /100 | #308 | Tragic 15.8% |
| Yup'ik | 0.0 /100 | #309 | Tragic 15.8% |
| Vietnamese | 0.0 /100 | #310 | Tragic 15.9% |
| Trinidadians and Tobagonians | 0.0 /100 | #311 | Tragic 15.9% |
| Crow | 0.0 /100 | #312 | Tragic 15.9% |
| Barbadians | 0.0 /100 | #313 | Tragic 16.0% |
| Tsimshian | 0.0 /100 | #314 | Tragic 16.1% |
| Guyanese | 0.0 /100 | #315 | Tragic 16.1% |
| Immigrants | Ecuador | 0.0 /100 | #316 | Tragic 16.1% |
| Immigrants | Guyana | 0.0 /100 | #317 | Tragic 16.2% |
| Houma | 0.0 /100 | #318 | Tragic 16.2% |
| Haitians | 0.0 /100 | #319 | Tragic 16.2% |
| Immigrants | Yemen | 0.0 /100 | #320 | Tragic 16.5% |
| Immigrants | Haiti | 0.0 /100 | #321 | Tragic 16.5% |
Demographics Similar to Immigrants from Switzerland by Seniors Poverty Over the Age of 75
In terms of seniors poverty over the age of 75, the demographic groups most similar to Immigrants from Switzerland are Egyptian (12.1%, a difference of 0.020%), Immigrants from Syria (12.2%, a difference of 0.050%), Immigrants from Egypt (12.2%, a difference of 0.070%), Okinawan (12.1%, a difference of 0.14%), and Immigrants from Thailand (12.2%, a difference of 0.21%).
| Demographics | Rating | Rank | Seniors Poverty Over the Age of 75 |
| Immigrants | Eastern Africa | 60.9 /100 | #160 | Good 12.1% |
| Immigrants | Norway | 60.6 /100 | #161 | Good 12.1% |
| Immigrants | Serbia | 60.2 /100 | #162 | Good 12.1% |
| Immigrants | Greece | 58.2 /100 | #163 | Average 12.1% |
| Potawatomi | 57.4 /100 | #164 | Average 12.1% |
| Okinawans | 56.3 /100 | #165 | Average 12.1% |
| Egyptians | 54.8 /100 | #166 | Average 12.1% |
| Immigrants | Switzerland | 54.5 /100 | #167 | Average 12.1% |
| Immigrants | Syria | 53.9 /100 | #168 | Average 12.2% |
| Immigrants | Egypt | 53.7 /100 | #169 | Average 12.2% |
| Immigrants | Thailand | 52.0 /100 | #170 | Average 12.2% |
| Spaniards | 51.6 /100 | #171 | Average 12.2% |
| Immigrants | Fiji | 51.5 /100 | #172 | Average 12.2% |
| Arabs | 50.5 /100 | #173 | Average 12.2% |
| Immigrants | Europe | 50.0 /100 | #174 | Average 12.2% |