Trinidadian and Tobagonian vs Bhutanese Female Poverty Among 25-34 Year Olds

COMPARE

Trinidadian and Tobagonian
Race
Ancestry
AfghanAfricanAlaska NativeAlaskan AthabascanAlbanianAleutAlsatianAmericanApacheArabArapahoArgentineanArmenianAssyrian/Chaldean/SyriacAustralianAustrianBahamianBangladeshiBarbadianBasqueBelgianBelizeanBermudanBlackfeetBolivianBrazilianBritishBritish West IndianBulgarianBurmeseCajunCambodianCanadianCape VerdeanCarpatho RusynCelticCentral AmericanCentral American IndianCherokeeCheyenneChickasawChileanChineseChippewaChoctawColombianColvilleComancheCosta RicanCreeCreekCroatianCrowCubanCypriotCzechCzechoslovakianDanishDelawareDominicanDutchDutch West IndianEastern EuropeanEcuadorianEgyptianEnglishEstonianEthiopianEuropeanFijianFilipinoFinnishFrenchFrench American IndianFrench CanadianGermanGerman RussianGhanaianGreekGuamanian/ChamorroGuatemalanGuyaneseHaitianHmongHonduranHopiHoumaHungarianIcelanderIndian (Asian)IndonesianInupiatIranianIraqiIrishIroquoisIsraeliItalianJamaicanJapaneseJordanianKenyanKiowaKoreanLaotianLatvianLebaneseLiberianLithuanianLumbeeLuxembourgerMacedonianMalaysianMalteseMarshalleseMenomineeMexicanMexican American IndianMongolianMoroccanNative HawaiianNavajoNepaleseNew ZealanderNicaraguanNigerianNorthern EuropeanNorwegianOkinawanOsageOttawaPaiutePakistaniPalestinianPanamanianParaguayanPennsylvania GermanPeruvianPimaPolishPortuguesePotawatomiPuebloPuerto RicanPuget Sound SalishRomanianRussianSalvadoranSamoanScandinavianScotch-IrishScottishSeminoleSenegaleseSerbianShoshoneSierra LeoneanSiouxSlavicSlovakSloveneSomaliSouth AfricanSouth AmericanSouth American IndianSoviet UnionSpaniardSpanishSpanish AmericanSpanish American IndianSri LankanSubsaharan AfricanSudaneseSwedishSwissSyrianTaiwaneseThaiTlingit-HaidaTohono O'OdhamTonganTrinidadian and TobagonianTsimshianTurkishU.S. Virgin IslanderUgandanUkrainianUruguayanUteVenezuelanVietnameseWelshWest IndianYakamaYaquiYugoslavianYumanYup'ikZimbabwean
Immigration
NonimmigrantsImmigrantsAfghanistanAfricaAlbaniaArgentinaArmeniaAsiaAustraliaAustriaBahamasBangladeshBarbadosBelarusBelgiumBelizeBoliviaBosnia and HerzegovinaBrazilBulgariaBurma/MyanmarCabo VerdeCambodiaCameroonCanadaCaribbeanCentral AmericaChileChinaColombiaCongoCosta RicaCroatiaCubaCzechoslovakiaDenmarkDominicaDominican RepublicEastern AfricaEastern AsiaEastern EuropeEcuadorEgyptEl SalvadorEnglandEritreaEthiopiaEuropeFijiFranceGermanyGhanaGreeceGrenadaGuatemalaGuyanaHaitiHondurasHong KongHungaryIndiaIndonesiaIranIraqIrelandIsraelItalyJamaicaJapanJordanKazakhstanKenyaKoreaKuwaitLaosLatin AmericaLatviaLebanonLiberiaLithuaniaMalaysiaMexicoMicronesiaMiddle AfricaMoldovaMoroccoNepalNetherlandsNicaraguaNigeriaNorth AmericaNorth MacedoniaNorthern AfricaNorthern EuropeNorwayOceaniaPakistanPanamaPeruPhilippinesPolandPortugalRomaniaRussiaSaudi ArabiaScotlandSenegalSerbiaSierra LeoneSingaporeSomaliaSouth AfricaSouth AmericaSouth Central AsiaSouth Eastern AsiaSouthern EuropeSpainSri LankaSt. Vincent and the GrenadinesSudanSwedenSwitzerlandSyriaTaiwanThailandTrinidad and TobagoTurkeyUgandaUkraineUruguayUzbekistanVenezuelaVietnamWest IndiesWestern AfricaWestern AsiaWestern EuropeYemenZaireZimbabweAzores
Bhutanese
Race
Ancestry
AfghanAfricanAlaska NativeAlaskan AthabascanAlbanianAleutAlsatianAmericanApacheArabArapahoArgentineanArmenianAssyrian/Chaldean/SyriacAustralianAustrianBahamianBangladeshiBarbadianBasqueBelgianBelizeanBermudanBhutaneseBlackfeetBolivianBrazilianBritishBritish West IndianBulgarianBurmeseCajunCambodianCanadianCape VerdeanCarpatho RusynCelticCentral AmericanCentral American IndianCherokeeCheyenneChickasawChileanChineseChippewaChoctawColombianColvilleComancheCosta RicanCreeCreekCroatianCrowCubanCypriotCzechCzechoslovakianDanishDelawareDominicanDutchDutch West IndianEastern EuropeanEcuadorianEgyptianEnglishEstonianEthiopianEuropeanFijianFilipinoFinnishFrenchFrench American IndianFrench CanadianGermanGerman RussianGhanaianGreekGuamanian/ChamorroGuatemalanGuyaneseHaitianHmongHonduranHopiHoumaHungarianIcelanderIndian (Asian)IndonesianInupiatIranianIraqiIrishIroquoisIsraeliItalianJamaicanJapaneseJordanianKenyanKiowaKoreanLaotianLatvianLebaneseLiberianLithuanianLumbeeLuxembourgerMacedonianMalaysianMalteseMarshalleseMenomineeMexicanMexican American IndianMongolianMoroccanNative HawaiianNavajoNepaleseNew ZealanderNicaraguanNigerianNorthern EuropeanNorwegianOkinawanOsageOttawaPaiutePakistaniPalestinianPanamanianParaguayanPennsylvania GermanPeruvianPimaPolishPortuguesePotawatomiPuebloPuerto RicanPuget Sound SalishRomanianRussianSalvadoranSamoanScandinavianScotch-IrishScottishSeminoleSenegaleseSerbianShoshoneSierra LeoneanSiouxSlavicSlovakSloveneSomaliSouth AfricanSouth AmericanSouth American IndianSoviet UnionSpaniardSpanishSpanish AmericanSpanish American IndianSri LankanSubsaharan AfricanSudaneseSwedishSwissSyrianTaiwaneseThaiTlingit-HaidaTohono O'OdhamTonganTsimshianTurkishU.S. Virgin IslanderUgandanUkrainianUruguayanUteVenezuelanVietnameseWelshWest IndianYakamaYaquiYugoslavianYumanYup'ikZimbabwean
Immigration
NonimmigrantsImmigrantsAfghanistanAfricaAlbaniaArgentinaArmeniaAsiaAustraliaAustriaBahamasBangladeshBarbadosBelarusBelgiumBelizeBoliviaBosnia and HerzegovinaBrazilBulgariaBurma/MyanmarCabo VerdeCambodiaCameroonCanadaCaribbeanCentral AmericaChileChinaColombiaCongoCosta RicaCroatiaCubaCzechoslovakiaDenmarkDominicaDominican RepublicEastern AfricaEastern AsiaEastern EuropeEcuadorEgyptEl SalvadorEnglandEritreaEthiopiaEuropeFijiFranceGermanyGhanaGreeceGrenadaGuatemalaGuyanaHaitiHondurasHong KongHungaryIndiaIndonesiaIranIraqIrelandIsraelItalyJamaicaJapanJordanKazakhstanKenyaKoreaKuwaitLaosLatin AmericaLatviaLebanonLiberiaLithuaniaMalaysiaMexicoMicronesiaMiddle AfricaMoldovaMoroccoNepalNetherlandsNicaraguaNigeriaNorth AmericaNorth MacedoniaNorthern AfricaNorthern EuropeNorwayOceaniaPakistanPanamaPeruPhilippinesPolandPortugalRomaniaRussiaSaudi ArabiaScotlandSenegalSerbiaSierra LeoneSingaporeSomaliaSouth AfricaSouth AmericaSouth Central AsiaSouth Eastern AsiaSouthern EuropeSpainSri LankaSt. Vincent and the GrenadinesSudanSwedenSwitzerlandSyriaTaiwanThailandTrinidad and TobagoTurkeyUgandaUkraineUruguayUzbekistanVenezuelaVietnamWest IndiesWestern AfricaWestern AsiaWestern EuropeYemenZaireZimbabweAzores
Female Poverty Among 25-34 Year Olds
Income
Poverty
Unemployment
Labor Participation
Family Structure
Vehicle Availability
Education Level
Disability

Female Poverty Among 25-34 Year Olds Comparison

Trinidadians and Tobagonians

Bhutanese

Tragic
Exceptional
14.2%
FEMALE POVERTY AMONG 25-34 YEAR OLDS
8.2/ 100
METRIC RATING
211th/ 347
METRIC RANK
11.4%
FEMALE POVERTY AMONG 25-34 YEAR OLDS
99.9/ 100
METRIC RATING
25th/ 347
METRIC RANK

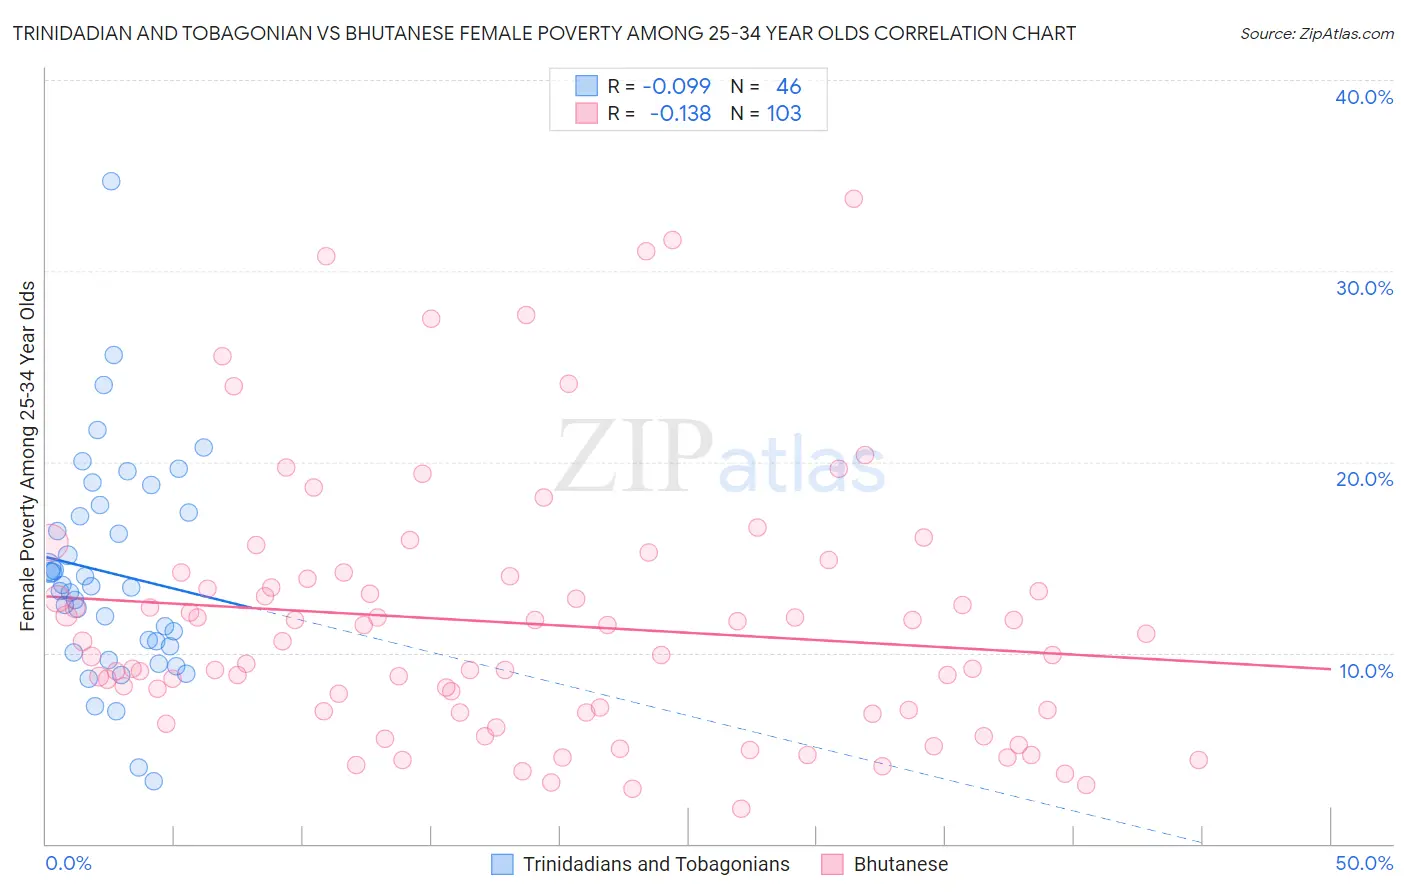
Trinidadian and Tobagonian vs Bhutanese Female Poverty Among 25-34 Year Olds Correlation Chart

The statistical analysis conducted on geographies consisting of 217,790,288 people shows a slight negative correlation between the proportion of Trinidadians and Tobagonians and poverty level among females between the ages 25 and 34 in the United States with a correlation coefficient (R) of -0.099 and weighted average of 14.2%. Similarly, the statistical analysis conducted on geographies consisting of 446,147,907 people shows a poor negative correlation between the proportion of Bhutanese and poverty level among females between the ages 25 and 34 in the United States with a correlation coefficient (R) of -0.138 and weighted average of 11.4%, a difference of 24.2%.
Trinidadian and Tobagonian vs Bhutanese Female Poverty Among 25-34 Year Olds

Female Poverty Among 25-34 Year Olds Correlation Summary

MeasurementTrinidadian and TobagonianBhutanese
Minimum3.3%1.8%
Maximum34.7%33.8%
Range31.4%31.9%
Mean14.2%11.5%
Median13.5%9.9%
Interquartile 25% (IQ1)10.3%6.9%
Interquartile 75% (IQ3)17.3%13.9%
Interquartile Range (IQR)7.0%7.0%
Standard Deviation (Sample)5.8%6.8%
Standard Deviation (Population)5.7%6.7%

Similar Demographics by Female Poverty Among 25-34 Year Olds

Demographics Similar to Trinidadians and Tobagonians by Female Poverty Among 25-34 Year Olds

In terms of female poverty among 25-34 year olds, the demographic groups most similar to Trinidadians and Tobagonians are Guyanese (14.2%, a difference of 0.12%), Panamanian (14.2%, a difference of 0.12%), Immigrants from Guyana (14.3%, a difference of 0.45%), Puget Sound Salish (14.3%, a difference of 0.48%), and French (14.3%, a difference of 0.58%).
DemographicsRating | RankFemale Poverty Among 25-34 Year Olds
Hawaiians
13.6
/100
|
#204
Poor
14.1%
Immigrants | Africa
13.4
/100
|
#205
Poor
14.1%
Hungarians
11.8
/100
|
#206
Poor
14.1%
Japanese
11.7
/100
|
#207
Poor
14.1%
Immigrants | Panama
11.6
/100
|
#208
Poor
14.1%
Guyanese
8.6
/100
|
#209
Tragic
14.2%
Panamanians
8.6
/100
|
#210
Tragic
14.2%
Trinidadians and Tobagonians
8.2
/100
|
#211
Tragic
14.2%
Immigrants | Guyana
6.6
/100
|
#212
Tragic
14.3%
Puget Sound Salish
6.5
/100
|
#213
Tragic
14.3%
French
6.2
/100
|
#214
Tragic
14.3%
Immigrants | Nigeria
6.2
/100
|
#215
Tragic
14.3%
French Canadians
5.5
/100
|
#216
Tragic
14.3%
Spanish American Indians
5.5
/100
|
#217
Tragic
14.3%
Immigrants | Thailand
5.2
/100
|
#218
Tragic
14.3%

Demographics Similar to Bhutanese by Female Poverty Among 25-34 Year Olds

In terms of female poverty among 25-34 year olds, the demographic groups most similar to Bhutanese are Tongan (11.5%, a difference of 0.15%), Maltese (11.4%, a difference of 0.22%), Bolivian (11.4%, a difference of 0.25%), Asian (11.4%, a difference of 0.31%), and Immigrants from Greece (11.5%, a difference of 0.45%).
DemographicsRating | RankFemale Poverty Among 25-34 Year Olds
Immigrants | Eastern Asia
100.0
/100
|
#18
Exceptional
11.2%
Iranians
100.0
/100
|
#19
Exceptional
11.2%
Okinawans
100.0
/100
|
#20
Exceptional
11.3%
Turks
100.0
/100
|
#21
Exceptional
11.4%
Asians
99.9
/100
|
#22
Exceptional
11.4%
Bolivians
99.9
/100
|
#23
Exceptional
11.4%
Maltese
99.9
/100
|
#24
Exceptional
11.4%
Bhutanese
99.9
/100
|
#25
Exceptional
11.4%
Tongans
99.9
/100
|
#26
Exceptional
11.5%
Immigrants | Greece
99.9
/100
|
#27
Exceptional
11.5%
Immigrants | Pakistan
99.9
/100
|
#28
Exceptional
11.5%
Bulgarians
99.9
/100
|
#29
Exceptional
11.5%
Cypriots
99.9
/100
|
#30
Exceptional
11.5%
Immigrants | Japan
99.9
/100
|
#31
Exceptional
11.6%
Immigrants | Asia
99.9
/100
|
#32
Exceptional
11.6%