Tlingit-Haida vs Marshallese Single Male Poverty
COMPARE
Tlingit-Haida
Marshallese
Single Male Poverty
Single Male Poverty Comparison
Tlingit-Haida
Marshallese
11.6%
SINGLE MALE POVERTY
99.9/ 100
METRIC RATING
49th/ 347
METRIC RANK
16.4%
SINGLE MALE POVERTY
0.0/ 100
METRIC RATING
320th/ 347
METRIC RANK
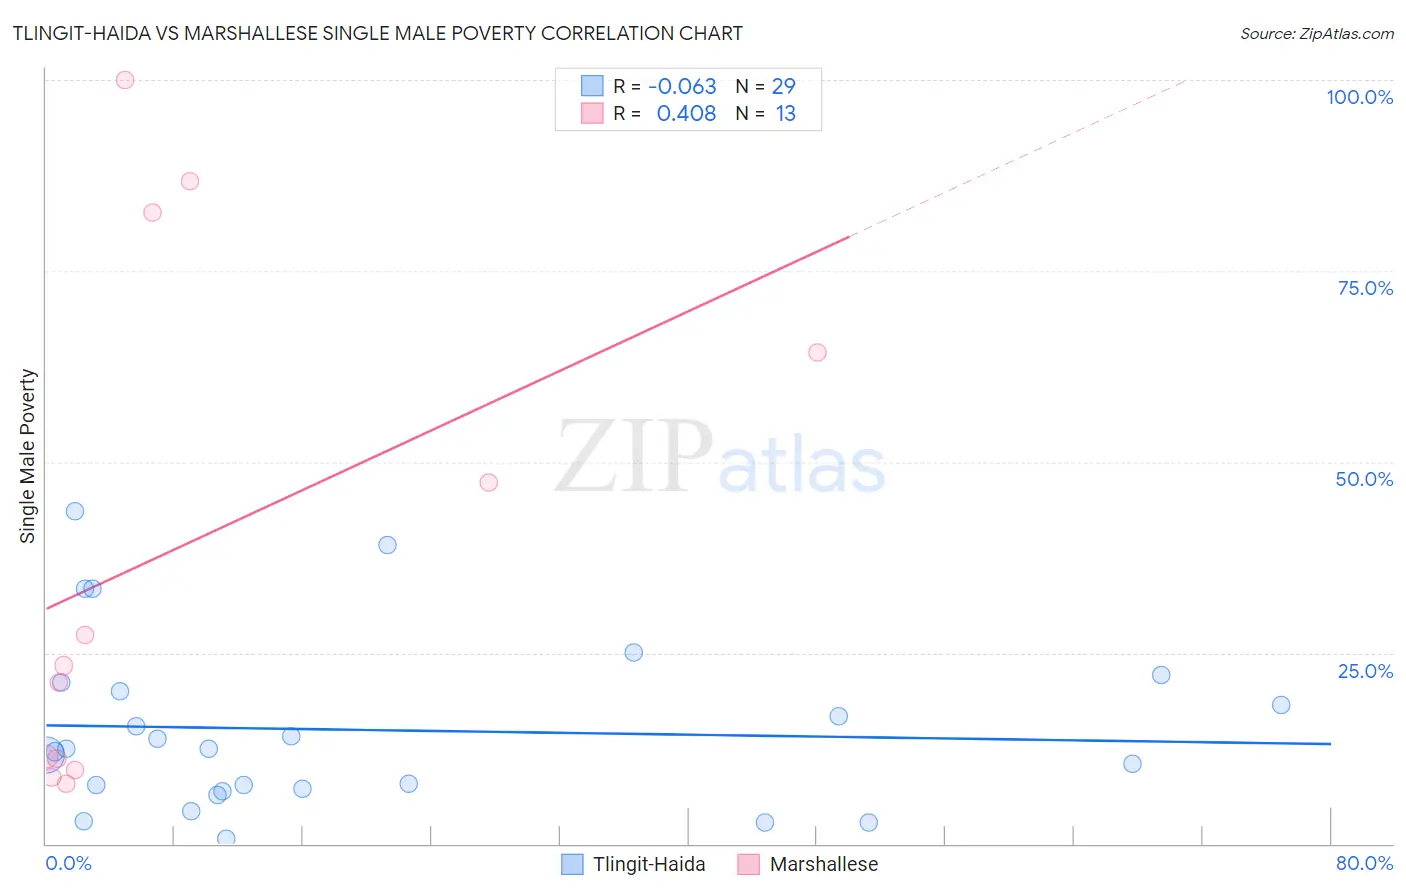
Tlingit-Haida vs Marshallese Single Male Poverty Correlation Chart
The statistical analysis conducted on geographies consisting of 58,517,751 people shows a slight negative correlation between the proportion of Tlingit-Haida and poverty level among single males in the United States with a correlation coefficient (R) of -0.063 and weighted average of 11.6%. Similarly, the statistical analysis conducted on geographies consisting of 14,469,521 people shows a moderate positive correlation between the proportion of Marshallese and poverty level among single males in the United States with a correlation coefficient (R) of 0.408 and weighted average of 16.4%, a difference of 41.8%.
Single Male Poverty Correlation Summary
| Measurement | Tlingit-Haida | Marshallese |
| Minimum | 0.66% | 7.9% |
| Maximum | 43.6% | 100.0% |
| Range | 43.0% | 92.1% |
| Mean | 14.9% | 38.6% |
| Median | 12.4% | 23.3% |
| Interquartile 25% (IQ1) | 7.1% | 10.4% |
| Interquartile 75% (IQ3) | 20.6% | 73.5% |
| Interquartile Range (IQR) | 13.5% | 63.1% |
| Standard Deviation (Sample) | 11.1% | 33.7% |
| Standard Deviation (Population) | 10.9% | 32.3% |
Similar Demographics by Single Male Poverty
Demographics Similar to Tlingit-Haida by Single Male Poverty
In terms of single male poverty, the demographic groups most similar to Tlingit-Haida are Immigrants from Indonesia (11.6%, a difference of 0.020%), Immigrants from Lithuania (11.6%, a difference of 0.060%), Nepalese (11.6%, a difference of 0.10%), Paraguayan (11.6%, a difference of 0.17%), and Immigrants from Bulgaria (11.6%, a difference of 0.29%).
| Demographics | Rating | Rank | Single Male Poverty |
| Egyptians | 99.9 /100 | #42 | Exceptional 11.5% |
| Immigrants | Peru | 99.9 /100 | #43 | Exceptional 11.5% |
| Immigrants | Cameroon | 99.9 /100 | #44 | Exceptional 11.5% |
| Immigrants | Poland | 99.9 /100 | #45 | Exceptional 11.5% |
| Immigrants | Bulgaria | 99.9 /100 | #46 | Exceptional 11.6% |
| Nepalese | 99.9 /100 | #47 | Exceptional 11.6% |
| Immigrants | Indonesia | 99.9 /100 | #48 | Exceptional 11.6% |
| Tlingit-Haida | 99.9 /100 | #49 | Exceptional 11.6% |
| Immigrants | Lithuania | 99.9 /100 | #50 | Exceptional 11.6% |
| Paraguayans | 99.9 /100 | #51 | Exceptional 11.6% |
| Samoans | 99.9 /100 | #52 | Exceptional 11.7% |
| Bulgarians | 99.9 /100 | #53 | Exceptional 11.7% |
| Immigrants | Uzbekistan | 99.9 /100 | #54 | Exceptional 11.7% |
| Cypriots | 99.9 /100 | #55 | Exceptional 11.7% |
| Burmese | 99.8 /100 | #56 | Exceptional 11.7% |
Demographics Similar to Marshallese by Single Male Poverty
In terms of single male poverty, the demographic groups most similar to Marshallese are Osage (16.5%, a difference of 0.13%), Chippewa (16.4%, a difference of 0.48%), Chickasaw (16.3%, a difference of 0.78%), Shoshone (16.7%, a difference of 1.4%), and Black/African American (16.2%, a difference of 1.6%).
| Demographics | Rating | Rank | Single Male Poverty |
| Cherokee | 0.0 /100 | #313 | Tragic 16.1% |
| Alaskan Athabascans | 0.0 /100 | #314 | Tragic 16.1% |
| Cheyenne | 0.0 /100 | #315 | Tragic 16.1% |
| Dutch West Indians | 0.0 /100 | #316 | Tragic 16.1% |
| Blacks/African Americans | 0.0 /100 | #317 | Tragic 16.2% |
| Chickasaw | 0.0 /100 | #318 | Tragic 16.3% |
| Chippewa | 0.0 /100 | #319 | Tragic 16.4% |
| Marshallese | 0.0 /100 | #320 | Tragic 16.4% |
| Osage | 0.0 /100 | #321 | Tragic 16.5% |
| Shoshone | 0.0 /100 | #322 | Tragic 16.7% |
| Creek | 0.0 /100 | #323 | Tragic 16.8% |
| Immigrants | Yemen | 0.0 /100 | #324 | Tragic 16.9% |
| Choctaw | 0.0 /100 | #325 | Tragic 17.0% |
| Central American Indians | 0.0 /100 | #326 | Tragic 17.2% |
| Menominee | 0.0 /100 | #327 | Tragic 17.7% |