Taiwanese vs Filipino Child Poverty Under the Age of 16

COMPARE

Taiwanese
Race
Ancestry
AfghanAfricanAlaska NativeAlaskan AthabascanAlbanianAleutAlsatianAmericanApacheArabArapahoArgentineanArmenianAssyrian/Chaldean/SyriacAustralianAustrianBahamianBangladeshiBarbadianBasqueBelgianBelizeanBermudanBhutaneseBlackfeetBolivianBrazilianBritishBritish West IndianBulgarianBurmeseCajunCambodianCanadianCape VerdeanCarpatho RusynCelticCentral AmericanCentral American IndianCherokeeCheyenneChickasawChileanChineseChippewaChoctawColombianColvilleComancheCosta RicanCreeCreekCroatianCrowCubanCypriotCzechCzechoslovakianDanishDelawareDominicanDutchDutch West IndianEastern EuropeanEcuadorianEgyptianEnglishEstonianEthiopianEuropeanFijianFinnishFrenchFrench American IndianFrench CanadianGermanGerman RussianGhanaianGreekGuamanian/ChamorroGuatemalanGuyaneseHaitianHmongHonduranHopiHoumaHungarianIcelanderIndian (Asian)IndonesianInupiatIranianIraqiIrishIroquoisIsraeliItalianJamaicanJapaneseJordanianKenyanKiowaKoreanLaotianLatvianLebaneseLiberianLithuanianLumbeeLuxembourgerMacedonianMalaysianMalteseMarshalleseMenomineeMexicanMexican American IndianMongolianMoroccanNative HawaiianNavajoNepaleseNew ZealanderNicaraguanNigerianNorthern EuropeanNorwegianOkinawanOsageOttawaPaiutePakistaniPalestinianPanamanianParaguayanPennsylvania GermanPeruvianPimaPolishPortuguesePotawatomiPuebloPuerto RicanPuget Sound SalishRomanianRussianSalvadoranSamoanScandinavianScotch-IrishScottishSeminoleSenegaleseSerbianShoshoneSierra LeoneanSiouxSlavicSlovakSloveneSomaliSouth AfricanSouth AmericanSouth American IndianSoviet UnionSpaniardSpanishSpanish AmericanSpanish American IndianSri LankanSubsaharan AfricanSudaneseSwedishSwissSyrianTaiwaneseThaiTlingit-HaidaTohono O'OdhamTonganTrinidadian and TobagonianTsimshianTurkishU.S. Virgin IslanderUgandanUkrainianUruguayanUteVenezuelanVietnameseWelshWest IndianYakamaYaquiYugoslavianYumanYup'ikZimbabwean
Immigration
NonimmigrantsImmigrantsAfghanistanAfricaAlbaniaArgentinaArmeniaAsiaAustraliaAustriaBahamasBangladeshBarbadosBelarusBelgiumBelizeBoliviaBosnia and HerzegovinaBrazilBulgariaBurma/MyanmarCabo VerdeCambodiaCameroonCanadaCaribbeanCentral AmericaChileChinaColombiaCongoCosta RicaCroatiaCubaCzechoslovakiaDenmarkDominicaDominican RepublicEastern AfricaEastern AsiaEastern EuropeEcuadorEgyptEl SalvadorEnglandEritreaEthiopiaEuropeFijiFranceGermanyGhanaGreeceGrenadaGuatemalaGuyanaHaitiHondurasHong KongHungaryIndiaIndonesiaIranIraqIrelandIsraelItalyJamaicaJapanJordanKazakhstanKenyaKoreaKuwaitLaosLatin AmericaLatviaLebanonLiberiaLithuaniaMalaysiaMexicoMicronesiaMiddle AfricaMoldovaMoroccoNepalNetherlandsNicaraguaNigeriaNorth AmericaNorth MacedoniaNorthern AfricaNorthern EuropeNorwayOceaniaPakistanPanamaPeruPhilippinesPolandPortugalRomaniaRussiaSaudi ArabiaScotlandSenegalSerbiaSierra LeoneSingaporeSomaliaSouth AfricaSouth AmericaSouth Central AsiaSouth Eastern AsiaSouthern EuropeSpainSri LankaSt. Vincent and the GrenadinesSudanSwedenSwitzerlandSyriaTaiwanThailandTrinidad and TobagoTurkeyUgandaUkraineUruguayUzbekistanVenezuelaVietnamWest IndiesWestern AfricaWestern AsiaWestern EuropeYemenZaireZimbabweAzores
Filipino
Race
Ancestry
AfghanAfricanAlaska NativeAlaskan AthabascanAlbanianAleutAlsatianAmericanApacheArabArapahoArgentineanArmenianAssyrian/Chaldean/SyriacAustralianAustrianBahamianBangladeshiBarbadianBasqueBelgianBelizeanBermudanBhutaneseBlackfeetBolivianBrazilianBritishBritish West IndianBulgarianBurmeseCajunCambodianCanadianCape VerdeanCarpatho RusynCelticCentral AmericanCentral American IndianCherokeeCheyenneChickasawChileanChineseChippewaChoctawColombianColvilleComancheCosta RicanCreeCreekCroatianCrowCubanCypriotCzechCzechoslovakianDanishDelawareDominicanDutchDutch West IndianEastern EuropeanEcuadorianEgyptianEnglishEstonianEthiopianEuropeanFijianFilipinoFinnishFrenchFrench American IndianFrench CanadianGermanGerman RussianGhanaianGreekGuamanian/ChamorroGuatemalanGuyaneseHaitianHmongHonduranHopiHoumaHungarianIcelanderIndian (Asian)IndonesianInupiatIranianIraqiIrishIroquoisIsraeliItalianJamaicanJapaneseJordanianKenyanKiowaKoreanLaotianLatvianLebaneseLiberianLithuanianLumbeeLuxembourgerMacedonianMalaysianMalteseMarshalleseMenomineeMexicanMexican American IndianMongolianMoroccanNative HawaiianNavajoNepaleseNew ZealanderNicaraguanNigerianNorthern EuropeanNorwegianOkinawanOsageOttawaPaiutePakistaniPalestinianPanamanianParaguayanPennsylvania GermanPeruvianPimaPolishPortuguesePotawatomiPuebloPuerto RicanPuget Sound SalishRomanianRussianSalvadoranSamoanScandinavianScotch-IrishScottishSeminoleSenegaleseSerbianShoshoneSierra LeoneanSiouxSlavicSlovakSloveneSomaliSouth AfricanSouth AmericanSouth American IndianSoviet UnionSpaniardSpanishSpanish AmericanSpanish American IndianSri LankanSubsaharan AfricanSudaneseSwedishSwissSyrianThaiTlingit-HaidaTohono O'OdhamTonganTrinidadian and TobagonianTsimshianTurkishU.S. Virgin IslanderUgandanUkrainianUruguayanUteVenezuelanVietnameseWelshWest IndianYakamaYaquiYugoslavianYumanYup'ikZimbabwean
Immigration
NonimmigrantsImmigrantsAfghanistanAfricaAlbaniaArgentinaArmeniaAsiaAustraliaAustriaBahamasBangladeshBarbadosBelarusBelgiumBelizeBoliviaBosnia and HerzegovinaBrazilBulgariaBurma/MyanmarCabo VerdeCambodiaCameroonCanadaCaribbeanCentral AmericaChileChinaColombiaCongoCosta RicaCroatiaCubaCzechoslovakiaDenmarkDominicaDominican RepublicEastern AfricaEastern AsiaEastern EuropeEcuadorEgyptEl SalvadorEnglandEritreaEthiopiaEuropeFijiFranceGermanyGhanaGreeceGrenadaGuatemalaGuyanaHaitiHondurasHong KongHungaryIndiaIndonesiaIranIraqIrelandIsraelItalyJamaicaJapanJordanKazakhstanKenyaKoreaKuwaitLaosLatin AmericaLatviaLebanonLiberiaLithuaniaMalaysiaMexicoMicronesiaMiddle AfricaMoldovaMoroccoNepalNetherlandsNicaraguaNigeriaNorth AmericaNorth MacedoniaNorthern AfricaNorthern EuropeNorwayOceaniaPakistanPanamaPeruPhilippinesPolandPortugalRomaniaRussiaSaudi ArabiaScotlandSenegalSerbiaSierra LeoneSingaporeSomaliaSouth AfricaSouth AmericaSouth Central AsiaSouth Eastern AsiaSouthern EuropeSpainSri LankaSt. Vincent and the GrenadinesSudanSwedenSwitzerlandSyriaTaiwanThailandTrinidad and TobagoTurkeyUgandaUkraineUruguayUzbekistanVenezuelaVietnamWest IndiesWestern AfricaWestern AsiaWestern EuropeYemenZaireZimbabweAzores
Child Poverty Under the Age of 16
Income
Poverty
Unemployment
Labor Participation
Family Structure
Vehicle Availability
Education Level
Disability

Child Poverty Under the Age of 16 Comparison

Taiwanese

Filipinos

Exceptional
Exceptional
14.5%
CHILD POVERTY UNDER THE AGE OF 16
97.1/ 100
METRIC RATING
87th/ 347
METRIC RANK
11.1%
CHILD POVERTY UNDER THE AGE OF 16
100.0/ 100
METRIC RATING
3rd/ 347
METRIC RANK

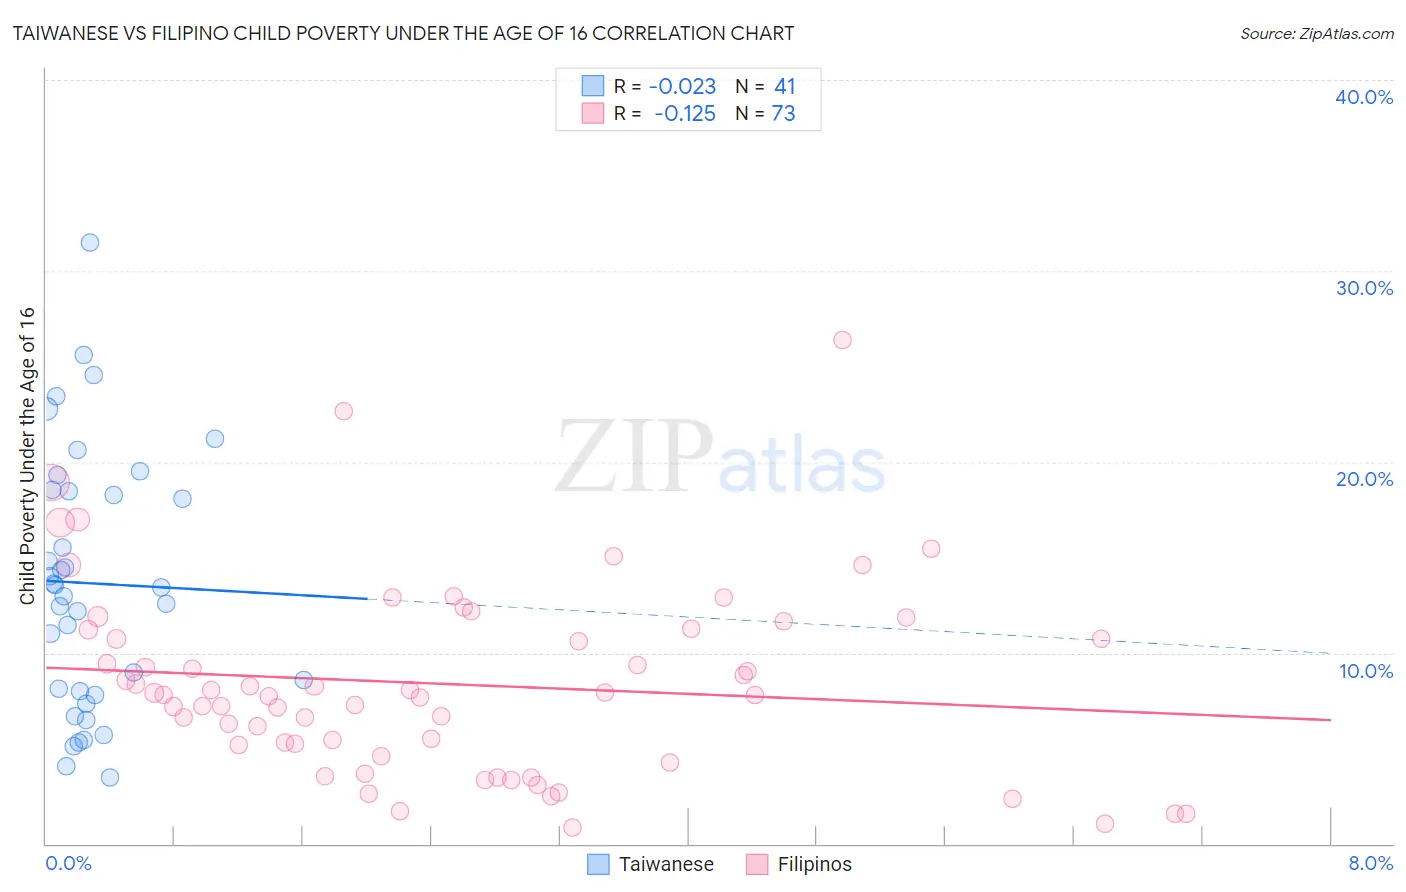
Taiwanese vs Filipino Child Poverty Under the Age of 16 Correlation Chart

The statistical analysis conducted on geographies consisting of 31,625,785 people shows no correlation between the proportion of Taiwanese and poverty level among children under the age of 16 in the United States with a correlation coefficient (R) of -0.023 and weighted average of 14.5%. Similarly, the statistical analysis conducted on geographies consisting of 252,527,529 people shows a poor negative correlation between the proportion of Filipinos and poverty level among children under the age of 16 in the United States with a correlation coefficient (R) of -0.125 and weighted average of 11.1%, a difference of 30.3%.
Taiwanese vs Filipino Child Poverty Under the Age of 16

Child Poverty Under the Age of 16 Correlation Summary

MeasurementTaiwaneseFilipino
Minimum3.4%0.84%
Maximum31.5%26.4%
Range28.1%25.5%
Mean13.6%8.4%
Median13.4%7.8%
Interquartile 25% (IQ1)7.9%4.9%
Interquartile 75% (IQ3)18.5%11.2%
Interquartile Range (IQR)10.6%6.3%
Standard Deviation (Sample)6.7%5.0%
Standard Deviation (Population)6.6%4.9%

Similar Demographics by Child Poverty Under the Age of 16

Demographics Similar to Taiwanese by Child Poverty Under the Age of 16

In terms of child poverty under the age of 16, the demographic groups most similar to Taiwanese are Immigrants from Argentina (14.5%, a difference of 0.0%), Soviet Union (14.5%, a difference of 0.080%), Immigrants from Latvia (14.5%, a difference of 0.10%), Northern European (14.5%, a difference of 0.10%), and Egyptian (14.5%, a difference of 0.12%).
DemographicsRating | RankChild Poverty Under the Age of 16
Immigrants | North Macedonia
97.2
/100
|
#80
Exceptional
14.5%
Finns
97.2
/100
|
#81
Exceptional
14.5%
Immigrants | Canada
97.2
/100
|
#82
Exceptional
14.5%
Egyptians
97.2
/100
|
#83
Exceptional
14.5%
Immigrants | Latvia
97.1
/100
|
#84
Exceptional
14.5%
Soviet Union
97.1
/100
|
#85
Exceptional
14.5%
Immigrants | Argentina
97.1
/100
|
#86
Exceptional
14.5%
Taiwanese
97.1
/100
|
#87
Exceptional
14.5%
Northern Europeans
97.0
/100
|
#88
Exceptional
14.5%
Germans
96.9
/100
|
#89
Exceptional
14.5%
Austrians
96.9
/100
|
#90
Exceptional
14.5%
Immigrants | North America
96.7
/100
|
#91
Exceptional
14.6%
Immigrants | Italy
96.7
/100
|
#92
Exceptional
14.6%
Argentineans
96.6
/100
|
#93
Exceptional
14.6%
Immigrants | South Africa
96.3
/100
|
#94
Exceptional
14.6%

Demographics Similar to Filipinos by Child Poverty Under the Age of 16

In terms of child poverty under the age of 16, the demographic groups most similar to Filipinos are Immigrants from Taiwan (11.0%, a difference of 0.85%), Immigrants from India (10.8%, a difference of 3.4%), Thai (11.6%, a difference of 3.9%), Chinese (11.9%, a difference of 7.1%), and Immigrants from Hong Kong (12.1%, a difference of 9.0%).
DemographicsRating | RankChild Poverty Under the Age of 16
Immigrants | India
100.0
/100
|
#1
Exceptional
10.8%
Immigrants | Taiwan
100.0
/100
|
#2
Exceptional
11.0%
Filipinos
100.0
/100
|
#3
Exceptional
11.1%
Thais
100.0
/100
|
#4
Exceptional
11.6%
Chinese
100.0
/100
|
#5
Exceptional
11.9%
Immigrants | Hong Kong
100.0
/100
|
#6
Exceptional
12.1%
Iranians
100.0
/100
|
#7
Exceptional
12.2%
Immigrants | Singapore
100.0
/100
|
#8
Exceptional
12.4%
Immigrants | Iran
100.0
/100
|
#9
Exceptional
12.4%
Immigrants | South Central Asia
99.9
/100
|
#10
Exceptional
12.5%
Bhutanese
99.9
/100
|
#11
Exceptional
12.5%
Immigrants | Ireland
99.9
/100
|
#12
Exceptional
12.7%
Burmese
99.9
/100
|
#13
Exceptional
12.8%
Immigrants | Lithuania
99.9
/100
|
#14
Exceptional
12.9%
Immigrants | Korea
99.9
/100
|
#15
Exceptional
13.0%