Syrian vs South African Female Poverty Among 18-24 Year Olds

COMPARE

Syrian
Race
Ancestry
AfghanAfricanAlaska NativeAlaskan AthabascanAlbanianAleutAlsatianAmericanApacheArabArapahoArgentineanArmenianAssyrian/Chaldean/SyriacAustralianAustrianBahamianBangladeshiBarbadianBasqueBelgianBelizeanBermudanBhutaneseBlackfeetBolivianBrazilianBritishBritish West IndianBulgarianBurmeseCajunCambodianCanadianCape VerdeanCarpatho RusynCelticCentral AmericanCentral American IndianCherokeeCheyenneChickasawChileanChineseChippewaChoctawColombianColvilleComancheCosta RicanCreeCreekCroatianCrowCubanCypriotCzechCzechoslovakianDanishDelawareDominicanDutchDutch West IndianEastern EuropeanEcuadorianEgyptianEnglishEstonianEthiopianEuropeanFijianFilipinoFinnishFrenchFrench American IndianFrench CanadianGermanGerman RussianGhanaianGreekGuamanian/ChamorroGuatemalanGuyaneseHaitianHmongHonduranHopiHoumaHungarianIcelanderIndian (Asian)IndonesianInupiatIranianIraqiIrishIroquoisIsraeliItalianJamaicanJapaneseJordanianKenyanKiowaKoreanLaotianLatvianLebaneseLiberianLithuanianLumbeeLuxembourgerMacedonianMalaysianMalteseMarshalleseMenomineeMexicanMexican American IndianMongolianMoroccanNative HawaiianNavajoNepaleseNew ZealanderNicaraguanNigerianNorthern EuropeanNorwegianOkinawanOsageOttawaPaiutePakistaniPalestinianPanamanianParaguayanPennsylvania GermanPeruvianPimaPolishPortuguesePotawatomiPuebloPuerto RicanPuget Sound SalishRomanianRussianSalvadoranSamoanScandinavianScotch-IrishScottishSeminoleSenegaleseSerbianShoshoneSierra LeoneanSiouxSlavicSlovakSloveneSomaliSouth AmericanSouth American IndianSoviet UnionSpaniardSpanishSpanish AmericanSpanish American IndianSri LankanSubsaharan AfricanSudaneseSwedishSwissSyrianTaiwaneseThaiTlingit-HaidaTohono O'OdhamTonganTrinidadian and TobagonianTsimshianTurkishU.S. Virgin IslanderUgandanUkrainianUruguayanUteVenezuelanVietnameseWelshWest IndianYakamaYaquiYugoslavianYumanYup'ikZimbabwean
Immigration
NonimmigrantsImmigrantsAfghanistanAfricaAlbaniaArgentinaArmeniaAsiaAustraliaAustriaBahamasBangladeshBarbadosBelarusBelgiumBelizeBoliviaBosnia and HerzegovinaBrazilBulgariaBurma/MyanmarCabo VerdeCambodiaCameroonCanadaCaribbeanCentral AmericaChileChinaColombiaCongoCosta RicaCroatiaCubaCzechoslovakiaDenmarkDominicaDominican RepublicEastern AfricaEastern AsiaEastern EuropeEcuadorEgyptEl SalvadorEnglandEritreaEthiopiaEuropeFijiFranceGermanyGhanaGreeceGrenadaGuatemalaGuyanaHaitiHondurasHong KongHungaryIndiaIndonesiaIranIraqIrelandIsraelItalyJamaicaJapanJordanKazakhstanKenyaKoreaKuwaitLaosLatin AmericaLatviaLebanonLiberiaLithuaniaMalaysiaMexicoMicronesiaMiddle AfricaMoldovaMoroccoNepalNetherlandsNicaraguaNigeriaNorth AmericaNorth MacedoniaNorthern AfricaNorthern EuropeNorwayOceaniaPakistanPanamaPeruPhilippinesPolandPortugalRomaniaRussiaSaudi ArabiaScotlandSenegalSerbiaSierra LeoneSingaporeSomaliaSouth AfricaSouth AmericaSouth Central AsiaSouth Eastern AsiaSouthern EuropeSpainSri LankaSt. Vincent and the GrenadinesSudanSwedenSwitzerlandSyriaTaiwanThailandTrinidad and TobagoTurkeyUgandaUkraineUruguayUzbekistanVenezuelaVietnamWest IndiesWestern AfricaWestern AsiaWestern EuropeYemenZaireZimbabweAzores
South African
Race
Ancestry
AfghanAfricanAlaska NativeAlaskan AthabascanAlbanianAleutAlsatianAmericanApacheArabArapahoArgentineanArmenianAssyrian/Chaldean/SyriacAustralianAustrianBahamianBangladeshiBarbadianBasqueBelgianBelizeanBermudanBhutaneseBlackfeetBolivianBrazilianBritishBritish West IndianBulgarianBurmeseCajunCambodianCanadianCape VerdeanCarpatho RusynCelticCentral AmericanCentral American IndianCherokeeCheyenneChickasawChileanChineseChippewaChoctawColombianColvilleComancheCosta RicanCreeCreekCroatianCrowCubanCypriotCzechCzechoslovakianDanishDelawareDominicanDutchDutch West IndianEastern EuropeanEcuadorianEgyptianEnglishEstonianEthiopianEuropeanFijianFilipinoFinnishFrenchFrench American IndianFrench CanadianGermanGerman RussianGhanaianGreekGuamanian/ChamorroGuatemalanGuyaneseHaitianHmongHonduranHopiHoumaHungarianIcelanderIndian (Asian)IndonesianInupiatIranianIraqiIrishIroquoisIsraeliItalianJamaicanJapaneseJordanianKenyanKiowaKoreanLaotianLatvianLebaneseLiberianLithuanianLumbeeLuxembourgerMacedonianMalaysianMalteseMarshalleseMenomineeMexicanMexican American IndianMongolianMoroccanNative HawaiianNavajoNepaleseNew ZealanderNicaraguanNigerianNorthern EuropeanNorwegianOkinawanOsageOttawaPaiutePakistaniPalestinianPanamanianParaguayanPennsylvania GermanPeruvianPimaPolishPortuguesePotawatomiPuebloPuerto RicanPuget Sound SalishRomanianRussianSalvadoranSamoanScandinavianScotch-IrishScottishSeminoleSenegaleseSerbianShoshoneSierra LeoneanSiouxSlavicSlovakSloveneSomaliSouth AfricanSouth AmericanSouth American IndianSoviet UnionSpaniardSpanishSpanish AmericanSpanish American IndianSri LankanSubsaharan AfricanSudaneseSwedishSwissTaiwaneseThaiTlingit-HaidaTohono O'OdhamTonganTrinidadian and TobagonianTsimshianTurkishU.S. Virgin IslanderUgandanUkrainianUruguayanUteVenezuelanVietnameseWelshWest IndianYakamaYaquiYugoslavianYumanYup'ikZimbabwean
Immigration
NonimmigrantsImmigrantsAfghanistanAfricaAlbaniaArgentinaArmeniaAsiaAustraliaAustriaBahamasBangladeshBarbadosBelarusBelgiumBelizeBoliviaBosnia and HerzegovinaBrazilBulgariaBurma/MyanmarCabo VerdeCambodiaCameroonCanadaCaribbeanCentral AmericaChileChinaColombiaCongoCosta RicaCroatiaCubaCzechoslovakiaDenmarkDominicaDominican RepublicEastern AfricaEastern AsiaEastern EuropeEcuadorEgyptEl SalvadorEnglandEritreaEthiopiaEuropeFijiFranceGermanyGhanaGreeceGrenadaGuatemalaGuyanaHaitiHondurasHong KongHungaryIndiaIndonesiaIranIraqIrelandIsraelItalyJamaicaJapanJordanKazakhstanKenyaKoreaKuwaitLaosLatin AmericaLatviaLebanonLiberiaLithuaniaMalaysiaMexicoMicronesiaMiddle AfricaMoldovaMoroccoNepalNetherlandsNicaraguaNigeriaNorth AmericaNorth MacedoniaNorthern AfricaNorthern EuropeNorwayOceaniaPakistanPanamaPeruPhilippinesPolandPortugalRomaniaRussiaSaudi ArabiaScotlandSenegalSerbiaSierra LeoneSingaporeSomaliaSouth AfricaSouth AmericaSouth Central AsiaSouth Eastern AsiaSouthern EuropeSpainSri LankaSt. Vincent and the GrenadinesSudanSwedenSwitzerlandSyriaTaiwanThailandTrinidad and TobagoTurkeyUgandaUkraineUruguayUzbekistanVenezuelaVietnamWest IndiesWestern AfricaWestern AsiaWestern EuropeYemenZaireZimbabweAzores
Female Poverty Among 18-24 Year Olds
Income
Poverty
Unemployment
Labor Participation
Family Structure
Vehicle Availability
Education Level
Disability

Female Poverty Among 18-24 Year Olds Comparison

Syrians

South Africans

Excellent
Tragic
19.8%
FEMALE POVERTY AMONG 18-24 YEAR OLDS
80.2/ 100
METRIC RATING
150th/ 347
METRIC RANK
21.1%
FEMALE POVERTY AMONG 18-24 YEAR OLDS
1.6/ 100
METRIC RATING
252nd/ 347
METRIC RANK

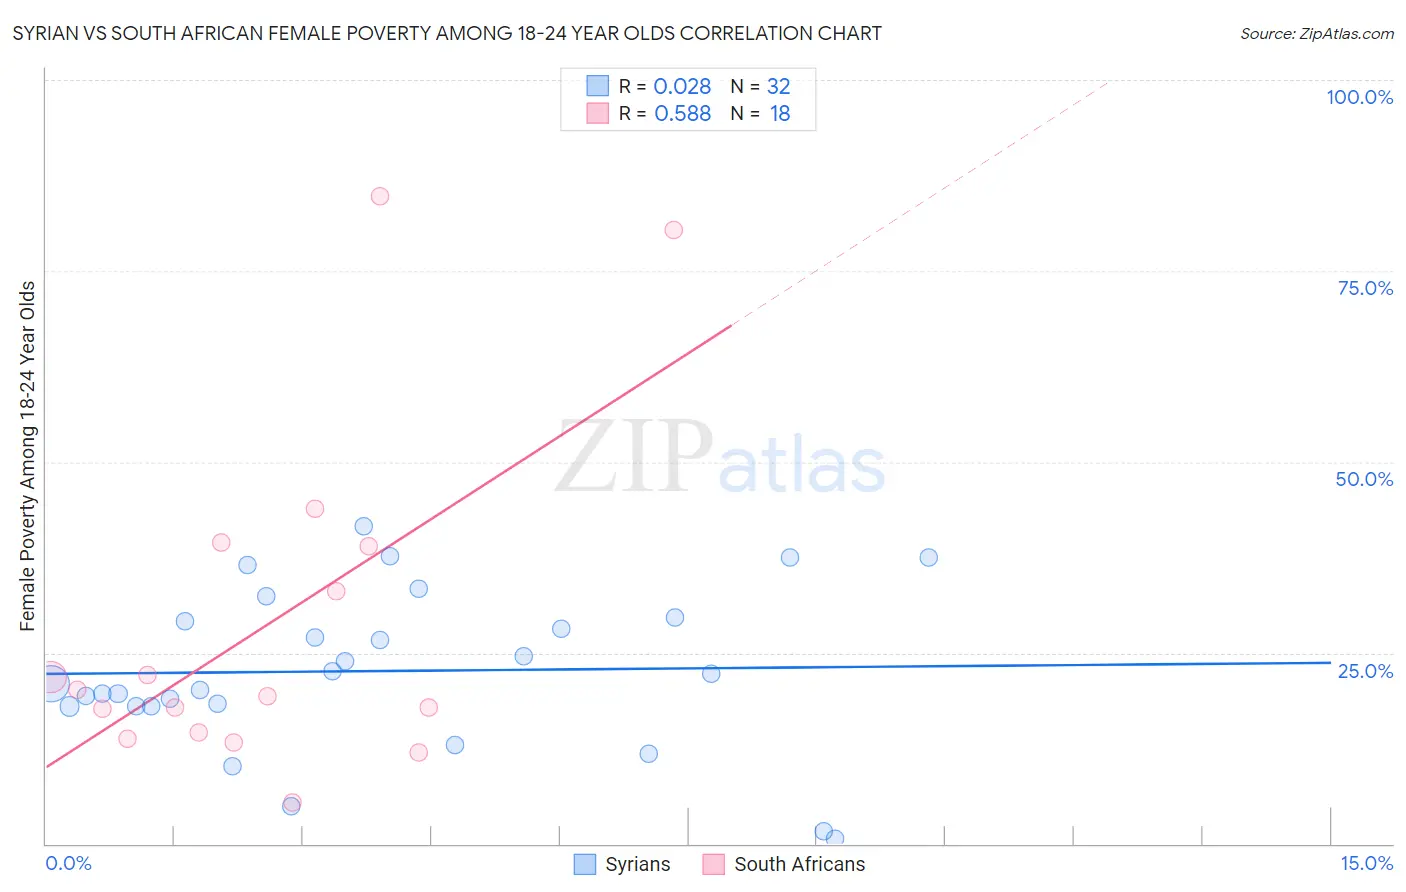
Syrian vs South African Female Poverty Among 18-24 Year Olds Correlation Chart

The statistical analysis conducted on geographies consisting of 261,305,691 people shows no correlation between the proportion of Syrians and poverty level among females between the ages 18 and 24 in the United States with a correlation coefficient (R) of 0.028 and weighted average of 19.8%. Similarly, the statistical analysis conducted on geographies consisting of 180,070,920 people shows a substantial positive correlation between the proportion of South Africans and poverty level among females between the ages 18 and 24 in the United States with a correlation coefficient (R) of 0.588 and weighted average of 21.1%, a difference of 6.9%.
Syrian vs South African Female Poverty Among 18-24 Year Olds

Female Poverty Among 18-24 Year Olds Correlation Summary

MeasurementSyrianSouth African
Minimum0.69%5.5%
Maximum41.6%84.8%
Range40.9%79.4%
Mean22.6%28.7%
Median21.6%19.7%
Interquartile 25% (IQ1)18.1%14.6%
Interquartile 75% (IQ3)29.4%38.9%
Interquartile Range (IQR)11.4%24.3%
Standard Deviation (Sample)10.4%22.2%
Standard Deviation (Population)10.2%21.6%

Similar Demographics by Female Poverty Among 18-24 Year Olds

Demographics Similar to Syrians by Female Poverty Among 18-24 Year Olds

In terms of female poverty among 18-24 year olds, the demographic groups most similar to Syrians are Immigrants from Eastern Asia (19.8%, a difference of 0.040%), Immigrants from Oceania (19.7%, a difference of 0.080%), Immigrants from Latin America (19.7%, a difference of 0.090%), Yugoslavian (19.8%, a difference of 0.090%), and Immigrants from Japan (19.8%, a difference of 0.16%).
DemographicsRating | RankFemale Poverty Among 18-24 Year Olds
Slavs
84.4
/100
|
#143
Excellent
19.7%
Immigrants | Northern Africa
84.1
/100
|
#144
Excellent
19.7%
Canadians
83.8
/100
|
#145
Excellent
19.7%
Immigrants | Bosnia and Herzegovina
83.6
/100
|
#146
Excellent
19.7%
Immigrants | Austria
83.1
/100
|
#147
Excellent
19.7%
Immigrants | Latin America
81.3
/100
|
#148
Excellent
19.7%
Immigrants | Oceania
81.2
/100
|
#149
Excellent
19.7%
Syrians
80.2
/100
|
#150
Excellent
19.8%
Immigrants | Eastern Asia
79.7
/100
|
#151
Good
19.8%
Yugoslavians
79.0
/100
|
#152
Good
19.8%
Immigrants | Japan
78.1
/100
|
#153
Good
19.8%
Immigrants | Zimbabwe
76.7
/100
|
#154
Good
19.8%
Hungarians
76.6
/100
|
#155
Good
19.8%
Immigrants | Belgium
76.4
/100
|
#156
Good
19.8%
Danes
75.5
/100
|
#157
Good
19.8%

Demographics Similar to South Africans by Female Poverty Among 18-24 Year Olds

In terms of female poverty among 18-24 year olds, the demographic groups most similar to South Africans are Delaware (21.1%, a difference of 0.040%), West Indian (21.1%, a difference of 0.18%), British West Indian (21.2%, a difference of 0.33%), Immigrants from Grenada (21.2%, a difference of 0.36%), and Immigrants from West Indies (21.0%, a difference of 0.38%).
DemographicsRating | RankFemale Poverty Among 18-24 Year Olds
Aleuts
3.3
/100
|
#245
Tragic
20.9%
Immigrants | Australia
3.1
/100
|
#246
Tragic
20.9%
Immigrants | Africa
3.0
/100
|
#247
Tragic
21.0%
Immigrants | Kenya
2.5
/100
|
#248
Tragic
21.0%
Carpatho Rusyns
2.5
/100
|
#249
Tragic
21.0%
Immigrants | West Indies
2.2
/100
|
#250
Tragic
21.0%
West Indians
1.9
/100
|
#251
Tragic
21.1%
South Africans
1.6
/100
|
#252
Tragic
21.1%
Delaware
1.6
/100
|
#253
Tragic
21.1%
British West Indians
1.2
/100
|
#254
Tragic
21.2%
Immigrants | Grenada
1.2
/100
|
#255
Tragic
21.2%
Tsimshian
1.0
/100
|
#256
Tragic
21.2%
Taiwanese
1.0
/100
|
#257
Tragic
21.2%
Vietnamese
0.6
/100
|
#258
Tragic
21.4%
Immigrants | France
0.6
/100
|
#259
Tragic
21.4%