Swiss vs Cypriot Poverty

COMPARE

Swiss
Race
Ancestry
AfghanAfricanAlaska NativeAlaskan AthabascanAlbanianAleutAlsatianAmericanApacheArabArapahoArgentineanArmenianAssyrian/Chaldean/SyriacAustralianAustrianBahamianBangladeshiBarbadianBasqueBelgianBelizeanBermudanBhutaneseBlackfeetBolivianBrazilianBritishBritish West IndianBulgarianBurmeseCajunCambodianCanadianCape VerdeanCarpatho RusynCelticCentral AmericanCentral American IndianCherokeeCheyenneChickasawChileanChineseChippewaChoctawColombianColvilleComancheCosta RicanCreeCreekCroatianCrowCubanCzechCzechoslovakianDanishDelawareDominicanDutchDutch West IndianEastern EuropeanEcuadorianEgyptianEnglishEstonianEthiopianEuropeanFijianFilipinoFinnishFrenchFrench American IndianFrench CanadianGermanGerman RussianGhanaianGreekGuamanian/ChamorroGuatemalanGuyaneseHaitianHmongHonduranHopiHoumaHungarianIcelanderIndian (Asian)IndonesianInupiatIranianIraqiIrishIroquoisIsraeliItalianJamaicanJapaneseJordanianKenyanKiowaKoreanLaotianLatvianLebaneseLiberianLithuanianLumbeeLuxembourgerMacedonianMalaysianMalteseMarshalleseMenomineeMexicanMexican American IndianMongolianMoroccanNative HawaiianNavajoNepaleseNew ZealanderNicaraguanNigerianNorthern EuropeanNorwegianOkinawanOsageOttawaPaiutePakistaniPalestinianPanamanianParaguayanPennsylvania GermanPeruvianPimaPolishPortuguesePotawatomiPuebloPuerto RicanPuget Sound SalishRomanianRussianSalvadoranSamoanScandinavianScotch-IrishScottishSeminoleSenegaleseSerbianShoshoneSierra LeoneanSiouxSlavicSlovakSloveneSomaliSouth AfricanSouth AmericanSouth American IndianSoviet UnionSpaniardSpanishSpanish AmericanSpanish American IndianSri LankanSubsaharan AfricanSudaneseSwedishSwissSyrianTaiwaneseThaiTlingit-HaidaTohono O'OdhamTonganTrinidadian and TobagonianTsimshianTurkishU.S. Virgin IslanderUgandanUkrainianUruguayanUteVenezuelanVietnameseWelshWest IndianYakamaYaquiYugoslavianYumanYup'ikZimbabwean
Immigration
NonimmigrantsImmigrantsAfghanistanAfricaAlbaniaArgentinaArmeniaAsiaAustraliaAustriaBahamasBangladeshBarbadosBelarusBelgiumBelizeBoliviaBosnia and HerzegovinaBrazilBulgariaBurma/MyanmarCabo VerdeCambodiaCameroonCanadaCaribbeanCentral AmericaChileChinaColombiaCongoCosta RicaCroatiaCubaCzechoslovakiaDenmarkDominicaDominican RepublicEastern AfricaEastern AsiaEastern EuropeEcuadorEgyptEl SalvadorEnglandEritreaEthiopiaEuropeFijiFranceGermanyGhanaGreeceGrenadaGuatemalaGuyanaHaitiHondurasHong KongHungaryIndiaIndonesiaIranIraqIrelandIsraelItalyJamaicaJapanJordanKazakhstanKenyaKoreaKuwaitLaosLatin AmericaLatviaLebanonLiberiaLithuaniaMalaysiaMexicoMicronesiaMiddle AfricaMoldovaMoroccoNepalNetherlandsNicaraguaNigeriaNorth AmericaNorth MacedoniaNorthern AfricaNorthern EuropeNorwayOceaniaPakistanPanamaPeruPhilippinesPolandPortugalRomaniaRussiaSaudi ArabiaScotlandSenegalSerbiaSierra LeoneSingaporeSomaliaSouth AfricaSouth AmericaSouth Central AsiaSouth Eastern AsiaSouthern EuropeSpainSri LankaSt. Vincent and the GrenadinesSudanSwedenSwitzerlandSyriaTaiwanThailandTrinidad and TobagoTurkeyUgandaUkraineUruguayUzbekistanVenezuelaVietnamWest IndiesWestern AfricaWestern AsiaWestern EuropeYemenZaireZimbabweAzores
Cypriot
Race
Ancestry
AfghanAfricanAlaska NativeAlaskan AthabascanAlbanianAleutAlsatianAmericanApacheArabArapahoArgentineanArmenianAssyrian/Chaldean/SyriacAustralianAustrianBahamianBangladeshiBarbadianBasqueBelgianBelizeanBermudanBhutaneseBlackfeetBolivianBrazilianBritishBritish West IndianBulgarianBurmeseCajunCambodianCanadianCape VerdeanCarpatho RusynCelticCentral AmericanCentral American IndianCherokeeCheyenneChickasawChileanChineseChippewaChoctawColombianColvilleComancheCosta RicanCreeCreekCroatianCrowCubanCypriotCzechCzechoslovakianDanishDelawareDominicanDutchDutch West IndianEastern EuropeanEcuadorianEgyptianEnglishEstonianEthiopianEuropeanFijianFilipinoFinnishFrenchFrench American IndianFrench CanadianGermanGerman RussianGhanaianGreekGuamanian/ChamorroGuatemalanGuyaneseHaitianHmongHonduranHopiHoumaHungarianIcelanderIndian (Asian)IndonesianInupiatIranianIraqiIrishIroquoisIsraeliItalianJamaicanJapaneseJordanianKenyanKiowaKoreanLaotianLatvianLebaneseLiberianLithuanianLumbeeLuxembourgerMacedonianMalaysianMalteseMarshalleseMenomineeMexicanMexican American IndianMongolianMoroccanNative HawaiianNavajoNepaleseNew ZealanderNicaraguanNigerianNorthern EuropeanNorwegianOkinawanOsageOttawaPaiutePakistaniPalestinianPanamanianParaguayanPennsylvania GermanPeruvianPimaPolishPortuguesePotawatomiPuebloPuerto RicanPuget Sound SalishRomanianRussianSalvadoranSamoanScandinavianScotch-IrishScottishSeminoleSenegaleseSerbianShoshoneSierra LeoneanSiouxSlavicSlovakSloveneSomaliSouth AfricanSouth AmericanSouth American IndianSoviet UnionSpaniardSpanishSpanish AmericanSpanish American IndianSri LankanSubsaharan AfricanSudaneseSwedishSyrianTaiwaneseThaiTlingit-HaidaTohono O'OdhamTonganTrinidadian and TobagonianTsimshianTurkishU.S. Virgin IslanderUgandanUkrainianUruguayanUteVenezuelanVietnameseWelshWest IndianYakamaYaquiYugoslavianYumanYup'ikZimbabwean
Immigration
NonimmigrantsImmigrantsAfghanistanAfricaAlbaniaArgentinaArmeniaAsiaAustraliaAustriaBahamasBangladeshBarbadosBelarusBelgiumBelizeBoliviaBosnia and HerzegovinaBrazilBulgariaBurma/MyanmarCabo VerdeCambodiaCameroonCanadaCaribbeanCentral AmericaChileChinaColombiaCongoCosta RicaCroatiaCubaCzechoslovakiaDenmarkDominicaDominican RepublicEastern AfricaEastern AsiaEastern EuropeEcuadorEgyptEl SalvadorEnglandEritreaEthiopiaEuropeFijiFranceGermanyGhanaGreeceGrenadaGuatemalaGuyanaHaitiHondurasHong KongHungaryIndiaIndonesiaIranIraqIrelandIsraelItalyJamaicaJapanJordanKazakhstanKenyaKoreaKuwaitLaosLatin AmericaLatviaLebanonLiberiaLithuaniaMalaysiaMexicoMicronesiaMiddle AfricaMoldovaMoroccoNepalNetherlandsNicaraguaNigeriaNorth AmericaNorth MacedoniaNorthern AfricaNorthern EuropeNorwayOceaniaPakistanPanamaPeruPhilippinesPolandPortugalRomaniaRussiaSaudi ArabiaScotlandSenegalSerbiaSierra LeoneSingaporeSomaliaSouth AfricaSouth AmericaSouth Central AsiaSouth Eastern AsiaSouthern EuropeSpainSri LankaSt. Vincent and the GrenadinesSudanSwedenSwitzerlandSyriaTaiwanThailandTrinidad and TobagoTurkeyUgandaUkraineUruguayUzbekistanVenezuelaVietnamWest IndiesWestern AfricaWestern AsiaWestern EuropeYemenZaireZimbabweAzores
Poverty
Income
Poverty
Unemployment
Labor Participation
Family Structure
Vehicle Availability
Education Level
Disability

Poverty Comparison

Swiss

Cypriots

Exceptional
Exceptional
11.2%
POVERTY
97.7/ 100
METRIC RATING
64th/ 347
METRIC RANK
10.8%
POVERTY
99.3/ 100
METRIC RATING
36th/ 347
METRIC RANK

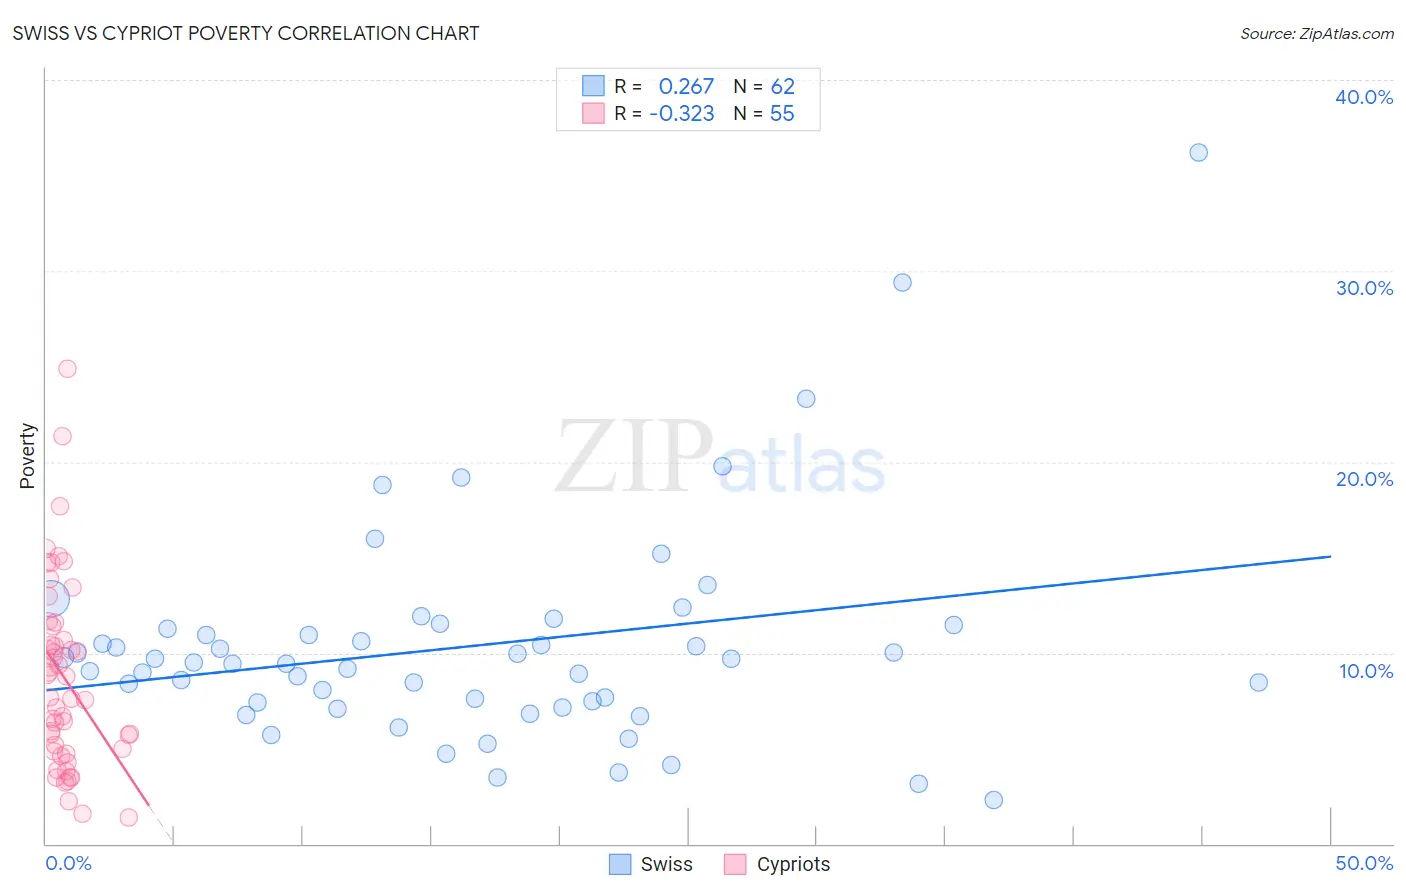
Swiss vs Cypriot Poverty Correlation Chart

The statistical analysis conducted on geographies consisting of 464,705,995 people shows a weak positive correlation between the proportion of Swiss and poverty level in the United States with a correlation coefficient (R) of 0.267 and weighted average of 11.2%. Similarly, the statistical analysis conducted on geographies consisting of 61,850,194 people shows a mild negative correlation between the proportion of Cypriots and poverty level in the United States with a correlation coefficient (R) of -0.323 and weighted average of 10.8%, a difference of 3.5%.
Swiss vs Cypriot Poverty

Poverty Correlation Summary

MeasurementSwissCypriot
Minimum2.3%1.4%
Maximum36.2%24.8%
Range33.9%23.5%
Mean10.3%8.7%
Median9.5%7.7%
Interquartile 25% (IQ1)7.4%4.9%
Interquartile 75% (IQ3)11.3%11.4%
Interquartile Range (IQR)3.9%6.5%
Standard Deviation (Sample)5.7%4.9%
Standard Deviation (Population)5.7%4.9%

Similar Demographics by Poverty

Demographics Similar to Swiss by Poverty

In terms of poverty, the demographic groups most similar to Swiss are Immigrants from Asia (11.2%, a difference of 0.13%), Immigrants from Netherlands (11.2%, a difference of 0.20%), Austrian (11.2%, a difference of 0.22%), Ukrainian (11.2%, a difference of 0.22%), and Immigrants from Australia (11.2%, a difference of 0.24%).
DemographicsRating | RankPoverty
Scandinavians
98.2
/100
|
#57
Exceptional
11.1%
Germans
98.1
/100
|
#58
Exceptional
11.1%
Immigrants | Europe
98.0
/100
|
#59
Exceptional
11.2%
Immigrants | Sri Lanka
97.9
/100
|
#60
Exceptional
11.2%
Immigrants | Italy
97.9
/100
|
#61
Exceptional
11.2%
Austrians
97.8
/100
|
#62
Exceptional
11.2%
Ukrainians
97.8
/100
|
#63
Exceptional
11.2%
Swiss
97.7
/100
|
#64
Exceptional
11.2%
Immigrants | Asia
97.5
/100
|
#65
Exceptional
11.2%
Immigrants | Netherlands
97.5
/100
|
#66
Exceptional
11.2%
Immigrants | Australia
97.4
/100
|
#67
Exceptional
11.2%
Slovaks
97.4
/100
|
#68
Exceptional
11.2%
Serbians
97.4
/100
|
#69
Exceptional
11.2%
Immigrants | Canada
97.3
/100
|
#70
Exceptional
11.3%
Zimbabweans
97.3
/100
|
#71
Exceptional
11.3%

Demographics Similar to Cypriots by Poverty

In terms of poverty, the demographic groups most similar to Cypriots are Tongan (10.8%, a difference of 0.080%), Immigrants from Greece (10.8%, a difference of 0.10%), Immigrants from Poland (10.8%, a difference of 0.12%), Czech (10.8%, a difference of 0.14%), and Macedonian (10.8%, a difference of 0.21%).
DemographicsRating | RankPoverty
Greeks
99.5
/100
|
#29
Exceptional
10.7%
Danes
99.5
/100
|
#30
Exceptional
10.7%
Poles
99.5
/100
|
#31
Exceptional
10.7%
Iranians
99.5
/100
|
#32
Exceptional
10.7%
Macedonians
99.4
/100
|
#33
Exceptional
10.8%
Immigrants | Poland
99.4
/100
|
#34
Exceptional
10.8%
Tongans
99.4
/100
|
#35
Exceptional
10.8%
Cypriots
99.3
/100
|
#36
Exceptional
10.8%
Immigrants | Greece
99.3
/100
|
#37
Exceptional
10.8%
Czechs
99.3
/100
|
#38
Exceptional
10.8%
Immigrants | Pakistan
99.3
/100
|
#39
Exceptional
10.8%
Russians
99.3
/100
|
#40
Exceptional
10.9%
Immigrants | Iran
99.2
/100
|
#41
Exceptional
10.9%
Koreans
99.2
/100
|
#42
Exceptional
10.9%
Immigrants | Singapore
99.2
/100
|
#43
Exceptional
10.9%