Subsaharan African vs Egyptian Single Male Poverty

COMPARE

Subsaharan African
Race
Ancestry
AfghanAfricanAlaska NativeAlaskan AthabascanAlbanianAleutAlsatianAmericanApacheArabArapahoArgentineanArmenianAssyrian/Chaldean/SyriacAustralianAustrianBahamianBangladeshiBarbadianBasqueBelgianBelizeanBermudanBhutaneseBlackfeetBolivianBrazilianBritishBritish West IndianBulgarianBurmeseCajunCambodianCanadianCape VerdeanCarpatho RusynCelticCentral AmericanCentral American IndianCherokeeCheyenneChickasawChileanChineseChippewaChoctawColombianColvilleComancheCosta RicanCreeCreekCroatianCrowCubanCypriotCzechCzechoslovakianDanishDelawareDominicanDutchDutch West IndianEastern EuropeanEcuadorianEnglishEstonianEthiopianEuropeanFijianFilipinoFinnishFrenchFrench American IndianFrench CanadianGermanGerman RussianGhanaianGreekGuamanian/ChamorroGuatemalanGuyaneseHaitianHmongHonduranHopiHoumaHungarianIcelanderIndian (Asian)IndonesianInupiatIranianIraqiIrishIroquoisIsraeliItalianJamaicanJapaneseJordanianKenyanKiowaKoreanLaotianLatvianLebaneseLiberianLithuanianLumbeeLuxembourgerMacedonianMalaysianMalteseMarshalleseMenomineeMexicanMexican American IndianMongolianMoroccanNative HawaiianNavajoNepaleseNew ZealanderNicaraguanNigerianNorthern EuropeanNorwegianOkinawanOsageOttawaPaiutePakistaniPalestinianPanamanianParaguayanPennsylvania GermanPeruvianPimaPolishPortuguesePotawatomiPuebloPuerto RicanPuget Sound SalishRomanianRussianSalvadoranSamoanScandinavianScotch-IrishScottishSeminoleSenegaleseSerbianShoshoneSierra LeoneanSiouxSlavicSlovakSloveneSomaliSouth AfricanSouth AmericanSouth American IndianSoviet UnionSpaniardSpanishSpanish AmericanSpanish American IndianSri LankanSubsaharan AfricanSudaneseSwedishSwissSyrianTaiwaneseThaiTlingit-HaidaTohono O'OdhamTonganTrinidadian and TobagonianTsimshianTurkishU.S. Virgin IslanderUgandanUkrainianUruguayanUteVenezuelanVietnameseWelshWest IndianYakamaYaquiYugoslavianYumanYup'ikZimbabwean
Immigration
NonimmigrantsImmigrantsAfghanistanAfricaAlbaniaArgentinaArmeniaAsiaAustraliaAustriaBahamasBangladeshBarbadosBelarusBelgiumBelizeBoliviaBosnia and HerzegovinaBrazilBulgariaBurma/MyanmarCabo VerdeCambodiaCameroonCanadaCaribbeanCentral AmericaChileChinaColombiaCongoCosta RicaCroatiaCubaCzechoslovakiaDenmarkDominicaDominican RepublicEastern AfricaEastern AsiaEastern EuropeEcuadorEgyptEl SalvadorEnglandEritreaEthiopiaEuropeFijiFranceGermanyGhanaGreeceGrenadaGuatemalaGuyanaHaitiHondurasHong KongHungaryIndiaIndonesiaIranIraqIrelandIsraelItalyJamaicaJapanJordanKazakhstanKenyaKoreaKuwaitLaosLatin AmericaLatviaLebanonLiberiaLithuaniaMalaysiaMexicoMicronesiaMiddle AfricaMoldovaMoroccoNepalNetherlandsNicaraguaNigeriaNorth AmericaNorth MacedoniaNorthern AfricaNorthern EuropeNorwayOceaniaPakistanPanamaPeruPhilippinesPolandPortugalRomaniaRussiaSaudi ArabiaScotlandSenegalSerbiaSierra LeoneSingaporeSomaliaSouth AfricaSouth AmericaSouth Central AsiaSouth Eastern AsiaSouthern EuropeSpainSri LankaSt. Vincent and the GrenadinesSudanSwedenSwitzerlandSyriaTaiwanThailandTrinidad and TobagoTurkeyUgandaUkraineUruguayUzbekistanVenezuelaVietnamWest IndiesWestern AfricaWestern AsiaWestern EuropeYemenZaireZimbabweAzores
Egyptian
Race
Ancestry
AfghanAfricanAlaska NativeAlaskan AthabascanAlbanianAleutAlsatianAmericanApacheArabArapahoArgentineanArmenianAssyrian/Chaldean/SyriacAustralianAustrianBahamianBangladeshiBarbadianBasqueBelgianBelizeanBermudanBhutaneseBlackfeetBolivianBrazilianBritishBritish West IndianBulgarianBurmeseCajunCambodianCanadianCape VerdeanCarpatho RusynCelticCentral AmericanCentral American IndianCherokeeCheyenneChickasawChileanChineseChippewaChoctawColombianColvilleComancheCosta RicanCreeCreekCroatianCrowCubanCypriotCzechCzechoslovakianDanishDelawareDominicanDutchDutch West IndianEastern EuropeanEcuadorianEgyptianEnglishEstonianEthiopianEuropeanFijianFilipinoFinnishFrenchFrench American IndianFrench CanadianGermanGerman RussianGhanaianGreekGuamanian/ChamorroGuatemalanGuyaneseHaitianHmongHonduranHopiHoumaHungarianIcelanderIndian (Asian)IndonesianInupiatIranianIraqiIrishIroquoisIsraeliItalianJamaicanJapaneseJordanianKenyanKiowaKoreanLaotianLatvianLebaneseLiberianLithuanianLumbeeLuxembourgerMacedonianMalaysianMalteseMarshalleseMenomineeMexicanMexican American IndianMongolianMoroccanNative HawaiianNavajoNepaleseNew ZealanderNicaraguanNigerianNorthern EuropeanNorwegianOkinawanOsageOttawaPaiutePakistaniPalestinianPanamanianParaguayanPennsylvania GermanPeruvianPimaPolishPortuguesePotawatomiPuebloPuerto RicanPuget Sound SalishRomanianRussianSalvadoranSamoanScandinavianScotch-IrishScottishSeminoleSenegaleseSerbianShoshoneSierra LeoneanSiouxSlavicSlovakSloveneSomaliSouth AfricanSouth AmericanSouth American IndianSoviet UnionSpaniardSpanishSpanish AmericanSpanish American IndianSri LankanSudaneseSwedishSwissSyrianTaiwaneseThaiTlingit-HaidaTohono O'OdhamTonganTrinidadian and TobagonianTsimshianTurkishU.S. Virgin IslanderUgandanUkrainianUruguayanUteVenezuelanVietnameseWelshWest IndianYakamaYaquiYugoslavianYumanYup'ikZimbabwean
Immigration
NonimmigrantsImmigrantsAfghanistanAfricaAlbaniaArgentinaArmeniaAsiaAustraliaAustriaBahamasBangladeshBarbadosBelarusBelgiumBelizeBoliviaBosnia and HerzegovinaBrazilBulgariaBurma/MyanmarCabo VerdeCambodiaCameroonCanadaCaribbeanCentral AmericaChileChinaColombiaCongoCosta RicaCroatiaCubaCzechoslovakiaDenmarkDominicaDominican RepublicEastern AfricaEastern AsiaEastern EuropeEcuadorEgyptEl SalvadorEnglandEritreaEthiopiaEuropeFijiFranceGermanyGhanaGreeceGrenadaGuatemalaGuyanaHaitiHondurasHong KongHungaryIndiaIndonesiaIranIraqIrelandIsraelItalyJamaicaJapanJordanKazakhstanKenyaKoreaKuwaitLaosLatin AmericaLatviaLebanonLiberiaLithuaniaMalaysiaMexicoMicronesiaMiddle AfricaMoldovaMoroccoNepalNetherlandsNicaraguaNigeriaNorth AmericaNorth MacedoniaNorthern AfricaNorthern EuropeNorwayOceaniaPakistanPanamaPeruPhilippinesPolandPortugalRomaniaRussiaSaudi ArabiaScotlandSenegalSerbiaSierra LeoneSingaporeSomaliaSouth AfricaSouth AmericaSouth Central AsiaSouth Eastern AsiaSouthern EuropeSpainSri LankaSt. Vincent and the GrenadinesSudanSwedenSwitzerlandSyriaTaiwanThailandTrinidad and TobagoTurkeyUgandaUkraineUruguayUzbekistanVenezuelaVietnamWest IndiesWestern AfricaWestern AsiaWestern EuropeYemenZaireZimbabweAzores
Single Male Poverty
Income
Poverty
Unemployment
Labor Participation
Family Structure
Vehicle Availability
Education Level
Disability

Single Male Poverty Comparison

Sub-Saharan Africans

Egyptians

Tragic
Exceptional
13.7%
SINGLE MALE POVERTY
0.5/ 100
METRIC RATING
254th/ 347
METRIC RANK
11.5%
SINGLE MALE POVERTY
99.9/ 100
METRIC RATING
42nd/ 347
METRIC RANK

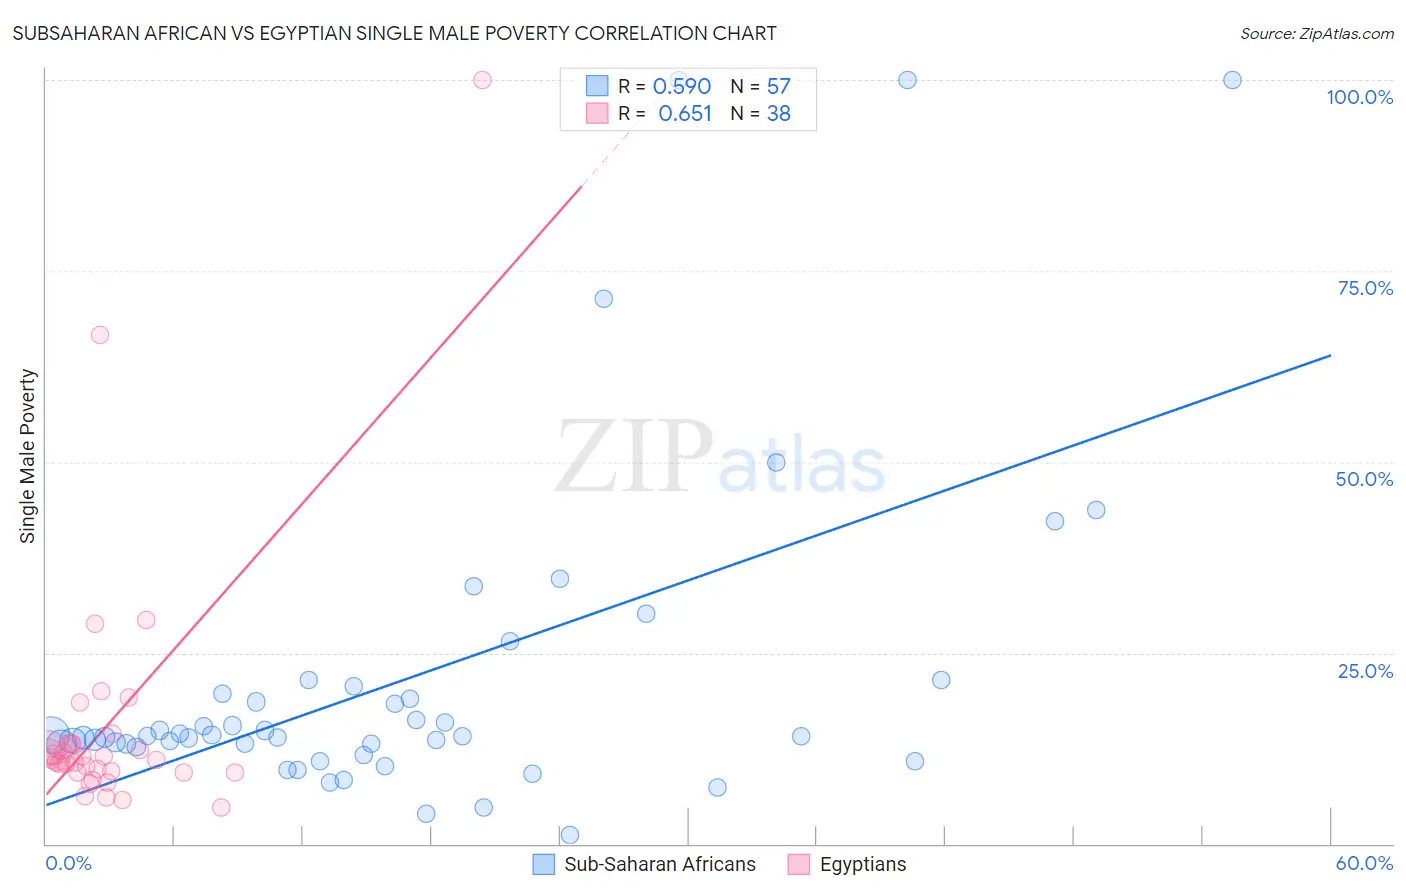
Subsaharan African vs Egyptian Single Male Poverty Correlation Chart

The statistical analysis conducted on geographies consisting of 440,120,617 people shows a substantial positive correlation between the proportion of Sub-Saharan Africans and poverty level among single males in the United States with a correlation coefficient (R) of 0.590 and weighted average of 13.7%. Similarly, the statistical analysis conducted on geographies consisting of 251,299,113 people shows a significant positive correlation between the proportion of Egyptians and poverty level among single males in the United States with a correlation coefficient (R) of 0.651 and weighted average of 11.5%, a difference of 18.8%.
Subsaharan African vs Egyptian Single Male Poverty

Single Male Poverty Correlation Summary

MeasurementSubsaharan AfricanEgyptian
Minimum1.1%4.7%
Maximum100.0%100.0%
Range98.9%95.3%
Mean21.8%15.8%
Median14.1%11.0%
Interquartile 25% (IQ1)12.8%9.4%
Interquartile 75% (IQ3)20.1%13.1%
Interquartile Range (IQR)7.3%3.8%
Standard Deviation (Sample)22.0%17.4%
Standard Deviation (Population)21.8%17.2%

Similar Demographics by Single Male Poverty

Demographics Similar to Sub-Saharan Africans by Single Male Poverty

In terms of single male poverty, the demographic groups most similar to Sub-Saharan Africans are Spaniard (13.7%, a difference of 0.11%), Immigrants from Belize (13.7%, a difference of 0.21%), Immigrants from Central America (13.8%, a difference of 0.40%), Immigrants from Guatemala (13.8%, a difference of 0.47%), and Guatemalan (13.8%, a difference of 0.51%).
DemographicsRating | RankSingle Male Poverty
Belgians
1.2
/100
|
#247
Tragic
13.5%
Czechs
1.2
/100
|
#248
Tragic
13.5%
Spanish
1.0
/100
|
#249
Tragic
13.6%
Immigrants | Somalia
1.0
/100
|
#250
Tragic
13.6%
Immigrants | Zaire
0.9
/100
|
#251
Tragic
13.6%
Finns
0.9
/100
|
#252
Tragic
13.6%
German Russians
0.8
/100
|
#253
Tragic
13.6%
Sub-Saharan Africans
0.5
/100
|
#254
Tragic
13.7%
Spaniards
0.4
/100
|
#255
Tragic
13.7%
Immigrants | Belize
0.4
/100
|
#256
Tragic
13.7%
Immigrants | Central America
0.3
/100
|
#257
Tragic
13.8%
Immigrants | Guatemala
0.3
/100
|
#258
Tragic
13.8%
Guatemalans
0.3
/100
|
#259
Tragic
13.8%
Swiss
0.3
/100
|
#260
Tragic
13.8%
Hungarians
0.3
/100
|
#261
Tragic
13.8%

Demographics Similar to Egyptians by Single Male Poverty

In terms of single male poverty, the demographic groups most similar to Egyptians are Immigrants from Iraq (11.5%, a difference of 0.050%), Immigrants from Peru (11.5%, a difference of 0.15%), Immigrants from Cameroon (11.5%, a difference of 0.17%), Immigrants from Poland (11.5%, a difference of 0.18%), and Immigrants from Korea (11.5%, a difference of 0.20%).
DemographicsRating | RankSingle Male Poverty
Immigrants | South Eastern Asia
100.0
/100
|
#35
Exceptional
11.4%
Immigrants | Serbia
100.0
/100
|
#36
Exceptional
11.4%
Immigrants | Singapore
100.0
/100
|
#37
Exceptional
11.4%
Sri Lankans
100.0
/100
|
#38
Exceptional
11.5%
Soviet Union
100.0
/100
|
#39
Exceptional
11.5%
Immigrants | Korea
100.0
/100
|
#40
Exceptional
11.5%
Immigrants | Iraq
99.9
/100
|
#41
Exceptional
11.5%
Egyptians
99.9
/100
|
#42
Exceptional
11.5%
Immigrants | Peru
99.9
/100
|
#43
Exceptional
11.5%
Immigrants | Cameroon
99.9
/100
|
#44
Exceptional
11.5%
Immigrants | Poland
99.9
/100
|
#45
Exceptional
11.5%
Immigrants | Bulgaria
99.9
/100
|
#46
Exceptional
11.6%
Nepalese
99.9
/100
|
#47
Exceptional
11.6%
Immigrants | Indonesia
99.9
/100
|
#48
Exceptional
11.6%
Tlingit-Haida
99.9
/100
|
#49
Exceptional
11.6%