Sri Lankan vs West Indian Seniors Poverty Over the Age of 65
COMPARE
Sri Lankan
West Indian
Seniors Poverty Over the Age of 65
Seniors Poverty Over the Age of 65 Comparison
Sri Lankans
West Indians
10.9%
SENIORS POVERTY OVER THE AGE OF 65
56.8/ 100
METRIC RATING
169th/ 347
METRIC RANK
14.1%
SENIORS POVERTY OVER THE AGE OF 65
0.0/ 100
METRIC RATING
304th/ 347
METRIC RANK
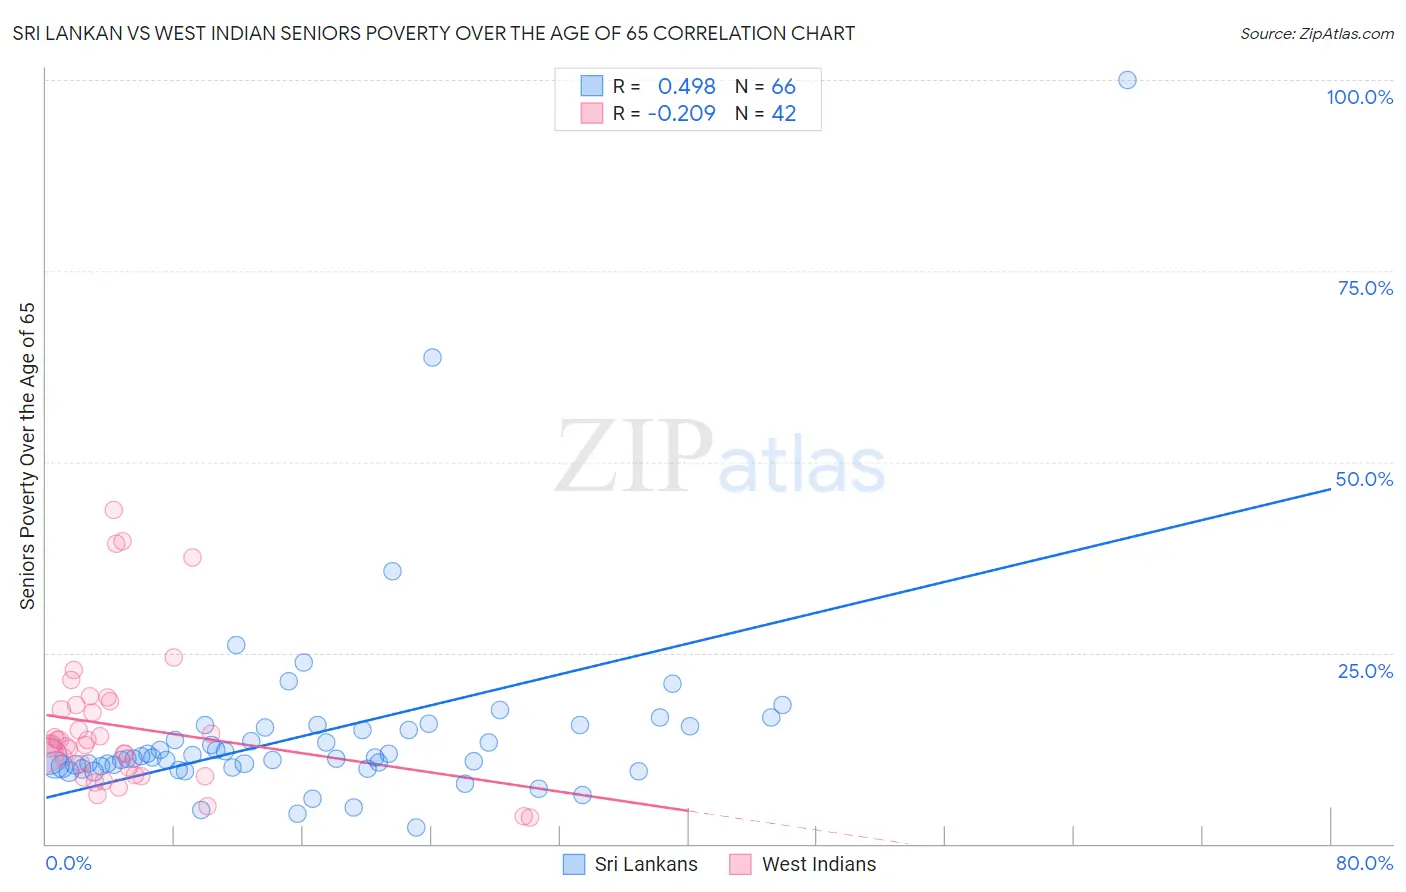
Sri Lankan vs West Indian Seniors Poverty Over the Age of 65 Correlation Chart
The statistical analysis conducted on geographies consisting of 438,555,706 people shows a moderate positive correlation between the proportion of Sri Lankans and poverty level among seniors over the age of 65 in the United States with a correlation coefficient (R) of 0.498 and weighted average of 10.9%. Similarly, the statistical analysis conducted on geographies consisting of 253,356,743 people shows a weak negative correlation between the proportion of West Indians and poverty level among seniors over the age of 65 in the United States with a correlation coefficient (R) of -0.209 and weighted average of 14.1%, a difference of 29.8%.
Seniors Poverty Over the Age of 65 Correlation Summary
| Measurement | Sri Lankan | West Indian |
| Minimum | 2.1% | 3.4% |
| Maximum | 100.0% | 43.8% |
| Range | 97.9% | 40.3% |
| Mean | 14.5% | 15.3% |
| Median | 11.3% | 13.0% |
| Interquartile 25% (IQ1) | 10.1% | 9.0% |
| Interquartile 75% (IQ3) | 15.2% | 18.1% |
| Interquartile Range (IQR) | 5.1% | 9.1% |
| Standard Deviation (Sample) | 13.4% | 9.5% |
| Standard Deviation (Population) | 13.3% | 9.3% |
Similar Demographics by Seniors Poverty Over the Age of 65
Demographics Similar to Sri Lankans by Seniors Poverty Over the Age of 65
In terms of seniors poverty over the age of 65, the demographic groups most similar to Sri Lankans are Immigrants from Eastern Europe (10.9%, a difference of 0.090%), Mongolian (10.9%, a difference of 0.10%), Nonimmigrants (10.9%, a difference of 0.16%), Immigrants from Syria (10.9%, a difference of 0.19%), and Alaska Native (10.8%, a difference of 0.32%).
| Demographics | Rating | Rank | Seniors Poverty Over the Age of 65 |
| Immigrants | Indonesia | 64.8 /100 | #162 | Good 10.8% |
| Tsimshian | 64.5 /100 | #163 | Good 10.8% |
| Potawatomi | 62.6 /100 | #164 | Good 10.8% |
| Immigrants | South Eastern Asia | 62.1 /100 | #165 | Good 10.8% |
| Malaysians | 62.0 /100 | #166 | Good 10.8% |
| Alaska Natives | 60.3 /100 | #167 | Good 10.8% |
| Mongolians | 58.0 /100 | #168 | Average 10.9% |
| Sri Lankans | 56.8 /100 | #169 | Average 10.9% |
| Immigrants | Eastern Europe | 55.8 /100 | #170 | Average 10.9% |
| Immigrants | Nonimmigrants | 55.1 /100 | #171 | Average 10.9% |
| Immigrants | Syria | 54.7 /100 | #172 | Average 10.9% |
| Spaniards | 50.7 /100 | #173 | Average 10.9% |
| Immigrants | Sudan | 50.0 /100 | #174 | Average 10.9% |
| Creek | 49.6 /100 | #175 | Average 10.9% |
| Immigrants | Malaysia | 47.9 /100 | #176 | Average 11.0% |
Demographics Similar to West Indians by Seniors Poverty Over the Age of 65
In terms of seniors poverty over the age of 65, the demographic groups most similar to West Indians are Immigrants from Trinidad and Tobago (14.1%, a difference of 0.060%), Immigrants from Bangladesh (14.1%, a difference of 0.24%), Yup'ik (14.1%, a difference of 0.35%), Immigrants from Latin America (14.2%, a difference of 0.36%), and U.S. Virgin Islander (14.0%, a difference of 0.43%).
| Demographics | Rating | Rank | Seniors Poverty Over the Age of 65 |
| Vietnamese | 0.0 /100 | #297 | Tragic 14.0% |
| Immigrants | Belize | 0.0 /100 | #298 | Tragic 14.0% |
| Ecuadorians | 0.0 /100 | #299 | Tragic 14.0% |
| Immigrants | Uzbekistan | 0.0 /100 | #300 | Tragic 14.0% |
| U.S. Virgin Islanders | 0.0 /100 | #301 | Tragic 14.0% |
| Yup'ik | 0.0 /100 | #302 | Tragic 14.1% |
| Immigrants | Bangladesh | 0.0 /100 | #303 | Tragic 14.1% |
| West Indians | 0.0 /100 | #304 | Tragic 14.1% |
| Immigrants | Trinidad and Tobago | 0.0 /100 | #305 | Tragic 14.1% |
| Immigrants | Latin America | 0.0 /100 | #306 | Tragic 14.2% |
| Immigrants | West Indies | 0.0 /100 | #307 | Tragic 14.2% |
| Trinidadians and Tobagonians | 0.0 /100 | #308 | Tragic 14.2% |
| Hondurans | 0.0 /100 | #309 | Tragic 14.2% |
| Bahamians | 0.0 /100 | #310 | Tragic 14.2% |
| Natives/Alaskans | 0.0 /100 | #311 | Tragic 14.2% |